Eclipse with EclEmma: Visualizing Code Coverage
In this post, we’ll look at how the big BDD and the smaller TDD feedback loops eliminate waste and how you can visualize that waste using code coverage tools like EclEmma to see whether you execute your process well.
The Relation Between BDD and TDD
Depending on your situation, running BDD scenarios may take a lot of time. For instance, you may need to first create a Web Application Archive (WAR), then start a web server, deploy your WAR, and finally run your automated acceptance tests using Selenium.
This is not a convenient feedback cycle to run for every single line of code you write.
So chances are that you’ll write bigger chunks of code. That increases the risk of introducing mistakes, however. Baby steps can mitigate that risk. In this case, that means moving to Test-First programming, preferably Test-Driven Development (TDD).
The link between a BDD scenario and a bunch of unit tests is the top-down test. The top-down test is a translation of the BDD scenario into test code. From there, you descend further down into unit tests using regular TDD.
This translation of BDD scenarios into top-down tests may seem wasteful, but it’s not.
Top-down tests only serve to give the developer a shorter feedback cycle. You should never have to leave your IDE to determine whether you’re done. The waste of the translation is more than made up for by the gains of not having to constantly switch to the larger BDD feedback cycle. By doing a little bit more work, you end up going faster!
If you’re worried about your build time increasing because of these top-down tests, you may even consider removing them after you’ve made them pass, since their risk-reducing job is then done.
Both BDD and TDD Eliminate Waste Using JIT Programming
Both BDD and TDD operate on the idea of Just-In-Time (JIT) coding. JIT is a Lean principle for eliminating waste; in this case of writing unnecessary code.
There are many reasons why you’d want to eliminate unnecessary code:
- Since it takes time to write code, writing less code means you’ll be more productive (finish more stories per iteration)
- More code means more bugs
- In particular, more code means more opportunities for security vulnerabilities
- More code means more things a future maintainer must understand, and thus a higher risk of bugs introduced during maintenance due to misunderstandings
Code Coverage Can Visualize Waste
With BDD and TDD in your software development process, you expect less waste. That’s the theory, at least. How do we prove this in practice?
Well, let’s look at the process:
- BDD scenarios define the acceptance criteria for the user stories
- Those BDD scenarios are translated into top-down tests
- Those top-down tests lead to unit tests
- Finally, those unit tests lead to production code
The last step is easiest to verify: no code should have been written that wasn’t necessary for making some unit test pass. We can prove that by measuring code coverage while we execute the unit tests. Any code that is not covered is by definition waste.
EclEmma Shows Code Coverage in Eclipse
We use Cobertura in our Continuous Integration build to measure code coverage. But that’s a long feedback cycle again.
Therefore, I like to use EclEmma to measure code coverage while I’m in the zone in Eclipse.
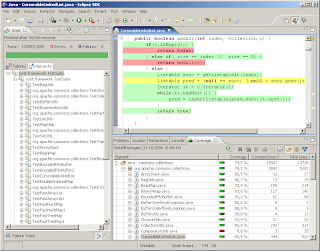
EclEmma turns covered lines green, uncovered lines red, and partially covered lines yellow.
You can change these colors using Window|Preferences|Java|Code coverage. For instance, you could change Full Coverage to white, so that the normal case doesn’t introduce visual clutter and only the exceptions stand out.
The great thing about EclEmma is that it let’s you measure code coverage without making you change the way you work.
The only difference is that instead of choosing Run As|JUnit Test (or Alt+Shift+X, T), you now choose Coverage As|JUnit test (or Alt+Shift+E, T). To re-run the last coverage, use Ctrl+Shift+F11 (instead of Ctrl+F11 to re-run the last launch).
If your fingers are conditioned to use Alt+Shift+X, T and/or Ctrl+F11, you can always change the key bindings using Window|Preferences|General|Keys.
In my experience, the performance overhead of EclEmma is low enough that you can use it all the time.
EclEmma Helps You Monitor Your Agile Process
The feedback from EclEmma allows you to immediately see any waste in the form of unnecessary code. Since there shouldn’t be any such waste if you do BDD and TDD well, the feedback from EclEmma is really feedback on how well you execute your BDD/TDD process. You can use this feedback to hone your skills and become the best developer you can be.
Reference: Visualizing Code Coverage in Eclipse with EclEmma from our JCG partner Remon Sinnema at the Secure Software Development blog.


Do you get the same code coverage results using EclEmma and Cobertura? The reason I ask is EclEmma produces different results to Clover which can be very serious if, like at my workplace, your build fails if code coverage drops below 100%. For this reason, I only every use one code coverage tool for a project.
Okay, I have to ask: How do you manage to maintain 100% test coverage in the face of checked exceptions? I usually end up having blocks of impossible checked exceptions (e.g. UnsupportedEncodingException for URL-encoding a string with UTF-8) pull down my coverage.