Ganglia configuration for a small Hadoop cluster and some troubleshooting
Ganglia is an open-source, scalable and distributed monitoring system for large clusters. It collects, aggregates and provides time-series views of tens of machine-related metrics such as CPU, memory, storage, network usage. You can see Ganglia in action at UC Berkeley Grid.
Ganglia is also a popular solution for monitoring Hadoop and HBase clusters, since Hadoop (and HBase) has built-in support for publishing its metrics to Ganglia. With Ganglia you may easily see the number of bytes written by a particular HDSF datanode over time, the block cache hit ratio for a given HBase region server, the total number of requests to the HBase cluster, time spent in garbage collection and many, many others.
Basic Ganglia overview
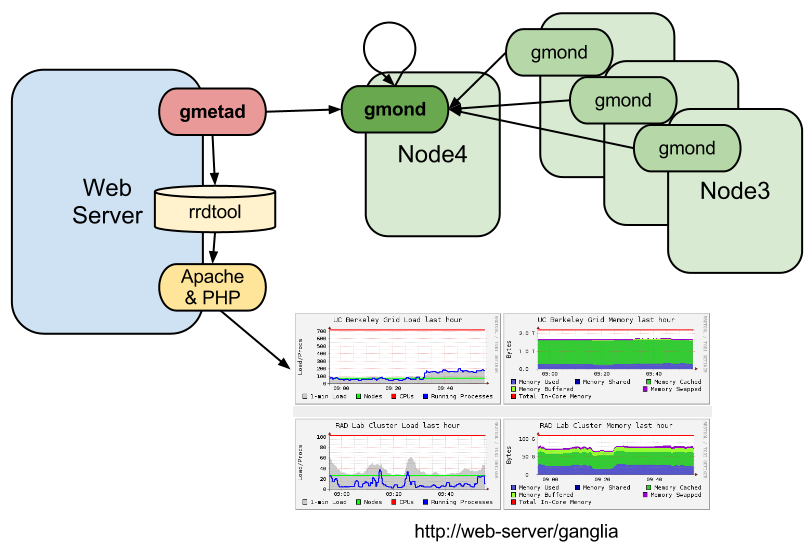
Ganglia consists of three components:
- Ganglia monitoring daemon (gmond) – a daemon which needs to run on every single node that is monitored. It collects local monitoring metrics and announce them, and (if configured) receives and aggregates metrics sent to it from othergmond
s (and even from itself). - Ganglia meta daemon (gmetad) – a daemon that polls from one or more data sources (a data source can be agmond or othergmetad) periodically to receive and aggregate the current metrics. The aggregated results are stored in database and can be exported as XML to other clients – for example, the web frontend.
- Ganglia PHP web frontend – it retrieves the combined metrics from the meta daemon and displays them in form of nice, dynamic HTML pages containing various real-time graphs.
If you want to learn more about gmond, gmetad and the web frontend, a very good description is available at Ganglia’s wikipedia page. Hope, that following picture (showing an exemplary configuration) helps to understand the idea:
In this post I will rather focus on configuration of Ganglia. If you are using Debian, please refer to the following tutorial to install it (just typing a couple of commands). We use Ganglia 3.1.7 in this post.
Ganglia for a small Hadoop cluster
While Ganglia is scalable, distributed and can monitor hundreds and even thousands of nodes, small clusters can also benefit from it (as well as developers and administrators, since Ganglia is a great empirical way to learn Hadoop and HBase internals). In this post I would like to describe how we configured Ganglia on a five-node cluster (1 masters and 4 slaves) that runs Hadoop and HBase. I believe that 5-node cluster (or similar size) is a typical configuration that many companies and organizations start using Hadoop with. Please note, that Ganglia is flexible enough to be configured in many ways. Here, I will simply describe what final effect I wanted to achieve and how it was done. Our monitoring requirements can be specified as follows:
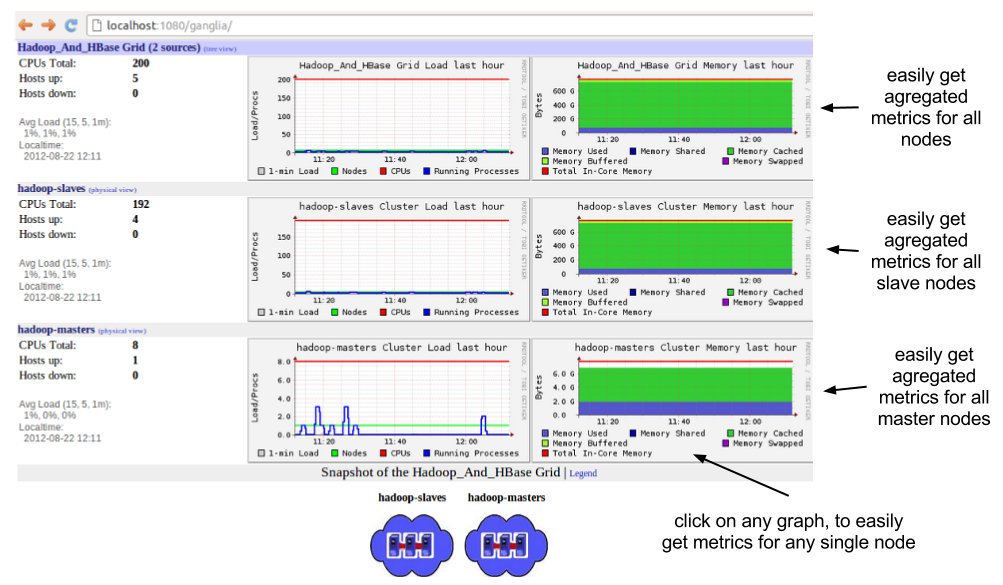
- easily get metrics from every single node
- easily get agregated metrics for all slave nodes (so that we will know how much resources is used by MapReduce jobs and HBase operations)
- easily get agregated metrics for all master nodes (so far we have only one master, but when the cluster grows, we will move some master deamons (e.g JobTracker, Secondary Namenode) to separate machines)
- easily get agregated metrics for all nodes (to get overall state of the cluster)
It means that I want Ganglia to see the cluster as two “logical” subclusters e.g. “masters” and “slaves”. Basically, I wish to see pages like this one:
Possible Ganglia’s configuration
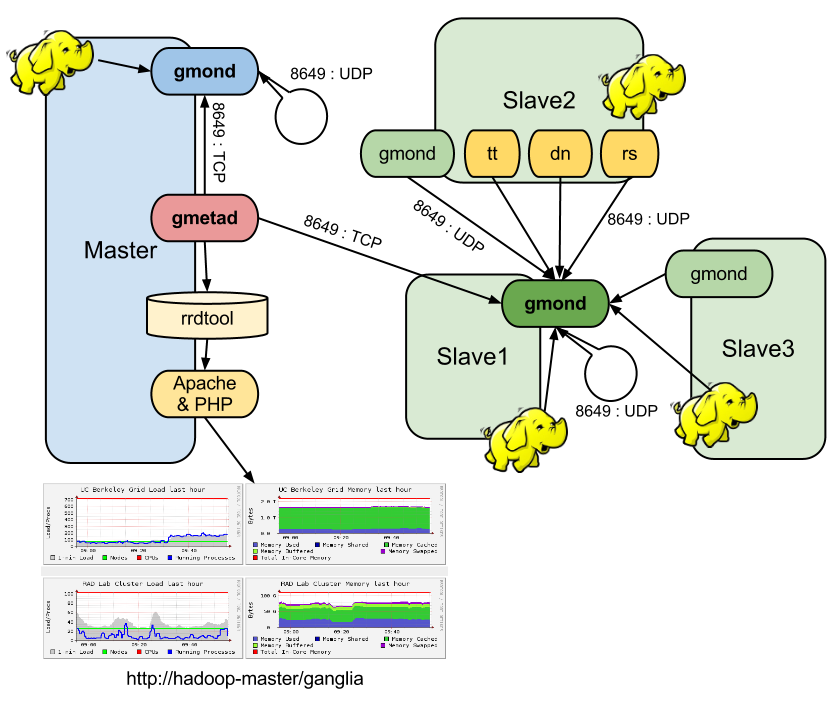
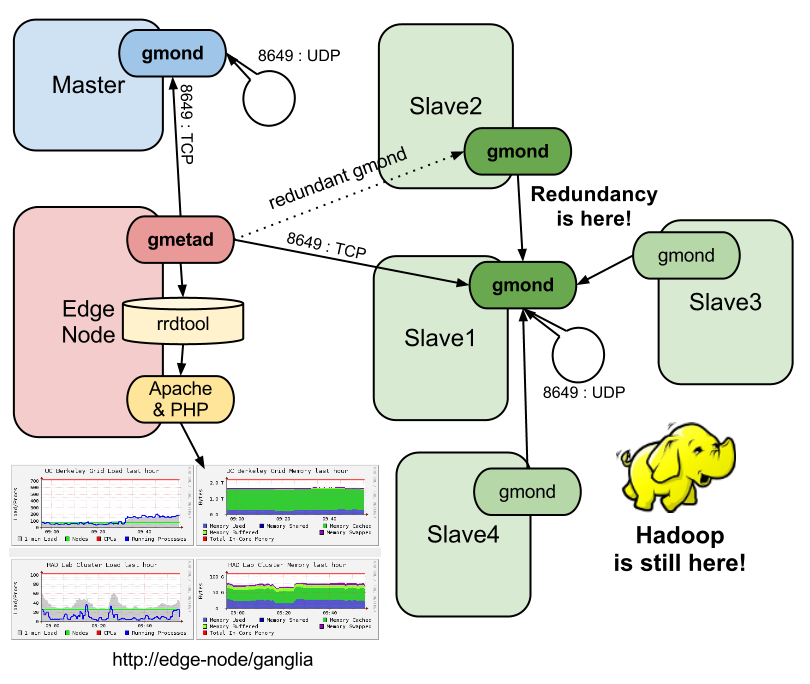
Here is an illustrative picture which shows simple Ganglia’s configuration for 5-node Hadoop cluster that meets our all requirements may look like. So let’s configure it in this way!
Please note, that we would like to keep as many default settings as possible. By default:
- gmond communicates on UDP port 8649 (specified inudp_send_channel andudp_recv_channel sections in gmond.conf)
- gmetad downloads metrics on TCP port 8649 (specified intcp_accept_channel section ingmond.conf, and in data_source entry in gmetad.conf)
However, one setting will be changed. We set the communication method between gmonds to be unicast UDP messages (instead of multicast UDP messages). Unicast has following advantages over multicast: it is better for a larger cluster (say a cluster with more than a hundred of nodes) and it is supported in the Amazon EC2 environment (unlike multicast).
Ganglia monitoring daemon (gmond) configuration
According to the picture above:
- Every node runs agmond.
Slaves subcluster configuration
- Eachgmond on slave1, slave2, slave3 and slave4 nodes definesudp_send_channel to send metrics to slave1 (port 8649)
- gmond on slave1 definesudp_recv_channel (port 8649) to listen to incoming metrics andtcp_accept_channel (port 8649) to announce them. This means this gmond is the “lead-node” for this subcluster and collects all metrics sent via UDP (port 8649) by all gmonds from slave nodes (even from itself), which can be polled later via TCP (port 8649) by gmetad.
Masters subcluster configuration
- gmond on master node definesudp_send_channel to send data to master (port 8649),udp_recv_channel (port 8649) and tcp_accept_channel (port 8649). This means it becomes the “lead node” for this one-node cluster and collects all metrics from itself and exposes them to gmetad. The configuration should be specified in gmond.conf file (you may find it in /etc/ganglia/). gmond.conf for slave1 (only the most important settings included):
cluster {
  name = 'hadoop-slaves'
  ...
}
udp_send_channel {
  host = slave1.node.IP.address
  port = 8649
}
udp_recv_channel {
  port = 8649
}
tcp_accept_channel {
  port = 8649
}
gmond.conf for slave2, slave3, slave4 (actually, the same gmond.conf file as for slave1 can be used as well):
cluster {
  name = 'hadoop-slaves'
  ...
}
udp_send_channel {
  host = slave1.node.IP.address
  port = 8649
}
udp_recv_channel {}
tcp_accept_channel {}
The gmond.conf file for the master node should be similar to slave1?s gmond.conf file – just replace slave1?s IP address with master’s IP and set cluster name to “hadoop-masters”. You can read more about gmond‘s configuration sections and attributes here.
Ganglia meta daemon (gmetad)
gmetad configuration is even simpler:
- Master runsgmetad
- gmetad defines two data sources:
data_source 'hadoop-masters' master.node.IP.address
data_source 'hadoop-slaves' slave1.node.IP.address
The configuration should be specified in gmetad.conf file (you may find it in /etc/ganglia/).
Hadoop and HBase integration with Ganglia
Hadoop and HBase use GangliaContext class to send the metrics collected by each daemon (such as datanode, tasktracker, jobtracker, HMaster etc) to gmonds. Once you have setup Ganglia successfully, you may want to edit /etc/hadoop/conf/hadoop-metrics.properties and /etc/hbase/conf/hadoop-metrics.properties to announce Hadoop and HBase-related metric to Ganglia. Since we use CDH 4.0.1 which is compatible with Ganglia releases 3.1.x, we use newly introduced GangliaContext31 (instead older GangliaContext class) in properties files.
Metrics configuration for slaves
# /etc/hadoop/conf/hadoop-metrics.properties
...
dfs.class=org.apache.hadoop.metrics.ganglia.GangliaContext31
dfs.period=10
dfs.servers=hadoop-slave1.IP.address:8649
...
mapred.class=org.apache.hadoop.metrics.ganglia.GangliaContext31
mapred.period=10
mapred.servers=hadoop-slave1.IP.address:8649
...
Metrics configuration for master
Should be the same as for slaves – just use hadoop-master.IP.address:8649 (instead of hadoop slave1.IP.address:8649) for example:
# /etc/hbase/conf/hadoop-metrics.properties
...
hbase.class=org.apache.hadoop.metrics.ganglia.GangliaContext31
hbase.period=10
hbase.servers=hadoop-master.IP.address:8649
...
Remember to edit both properties files (/etc/hadoop/conf/hadoop-metrics.properties for Hadoop and /etc/hbase/conf/hadoop-metrics.properties for HBase) on all nodes and then restart Hadoop and HBase clusters. No further configuration is necessary.
Some more details
Actually, I was surprised that Hadoop’s deamons really send data somewhere, instead of just being polled for this data. What does it mean? It means, for example, that every single slave node runs several processes (e.g. gmond, datanode, tasktracker and regionserver) that collect the metrics and send them to gmond running on slave1 node. If we stop gmonds on slave2, slave3 and slave4, but still run Hadoop’s daemons, we will still get metrics related to Hadoop (but do not get metrics about memory, cpu usage as they were to be send by stopped gmond s). Please look at slave2 node in the picture bellow to see (more or less) how it works (tt, dd and rs denotes tasktracker, datanode and regionserver respectively, while slave4 was removed in order to increase readability).
Single points of failure
This configuration works well until nodes starts to fail. And we know that they will! And we know that, unfortunately, our configuration has at least two single points of failure (SPoF):
- gmond on slave1 (if this node fails, all monitoring statistics about all slave nodes will be unavailable)
- gmetad and the web frontend on master (if this node fails, the full monitoring system will be unavailable. It means that we not only loose the most important Hadoop node (actually, it should be called SUPER-master since it has so many master daemons installed, but we also loose the valuable source of monitoring information that may help us detect the cause of failure by looking at graphs and metrics for this node that were generated just a moment before the failure)
Avoiding Ganglia’s SPoF on slave1 node
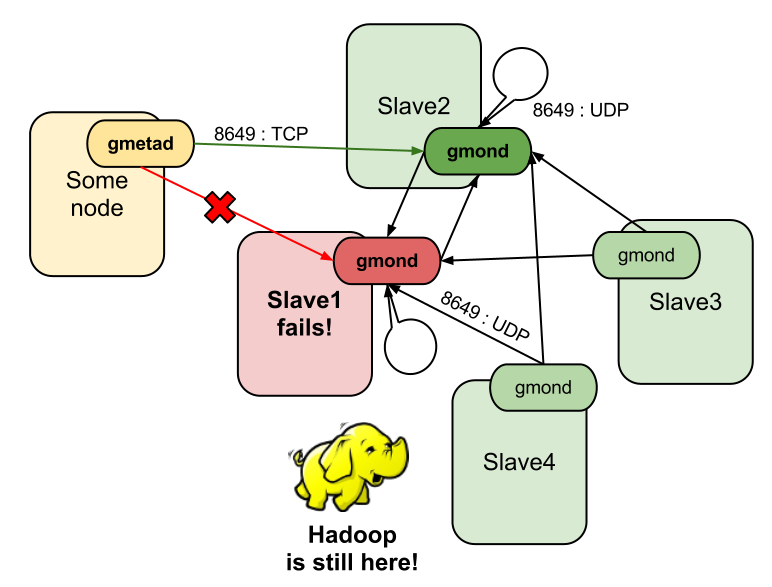
Fortunately, you may specify as many udp_send_channels as you like to send metrics redundantly to other gmond s (assuming that these gmond s specify udp_recv_channels to listen to incoming metrics). In our case, we may select slave2 to be also additional lead node (together with slave1) to collect metrics redundantly (and announce to them to gmetad
- updategmond.conf on all slave nodes and define additionaludp_send_channel section to send metrics to slave2 (port 8649)
- updategmond.conf s on slave2 to defineudp_recv_channel (port 8649) to listen to incoming metrics and tcp_accept_channel (port 8649) to announce them (the same settings should be already set in gmond.conf s on slave1)
- updatehadoop-metrics.properties file for Hadoop and HBase daemons running on slave nodes to send their metrics to both slave1 and slave2 e.g.:
# /etc/hbase/conf/hadoop-metrics.properties
...
hbase.class=org.apache.hadoop.metrics.ganglia.GangliaContext31
hbase.period=10
hbase.servers=hadoop-slave1.IP.address:8649,hadoop-slave2.IP.address:8649
- finally updatedata_source “hadoop-slaves” ingmetad.conf to poll data from two redundant gmond s (if gmetad cannot pull the data from slave1.node.IP.address, it will continue trying slave2.node.IP.address):
data_source 'hadoop-slaves' slave1.node.IP.address slave2.node.IP.address
Perhaps the picture bellow is not fortunate (so many arrows), but it intends to say that if slave1 fails, then gmetad will be able to take metrics from gmond on slave2 node (since all slave nodes send metrics redundantly to gmond s running on slave1 and slave2).
Avoiding Ganglia’s SPoF on master node
The main idea here is not to collocate gmetad (and the web frontend) with Hadoop master daemons, so that we will not loose monitoring statistics if the master node fails (or simply become unavailable). One idea is to, for example, move gmetad (and the web frontend) from slave1 to slave3 (or slave4) or simply introduce a redundant gmetad running on slave3 (or slave4). The former idea seems to be quite OK, while the later makes things quite complicated for such a small cluster. I guess that even better idea is to introduce an additional node (called “edge” node, if possible) that runs gmetad and the web frontend (it may also have base Hadoop and HBase packages installed, but it does not run any Hadoop’s daemons – it acts as a client machine only to launch MapReduce jobs and access HBase). Actually, the “edge” node is commonly used practice to provide the interface between users and the cluster (e.g. it runs Pig and Hive, Oozie).
Troubleshooting and tips that may help
Since debugging various aspects of the configuration was the longest part of setting up Ganglia, I share some tips here. Note that is does not cover all possible troubleshooting, but it is rather based on problems that we have encountered and finally managed to solve.
Start small
Although the process configuration of Ganglia is not so complex, it is good to start with only two nodes and if it works, grew that to a larger cluster. But before, you install any Ganglia’s daemon…
Try to send “Hello” from node1 to node2
Make sure that you can talk to port 8649 on the given target host using UDP protocol. netcat is a simple tool, that helps you to verify it. Open port 8649 on node1 (called the “lead node” later) for inbound UDP connections, and then send some text to it from node2.
# listen (-l option) for inbound UDP (-u option) connections on port 8649
# and prints received data
akawa@hadoop-slave1:~$ nc -u -l -p 8649
# create a UDP (-u option) connection to hadoop-slave1:8649
# and send text from stdin to that node:
akawa@hadoop-slave2:~$ nc -u hadoop-slave1 8649
Hello My Lead Node
# look at slave1's console to see if the text was sucessfully delivered
akawa@hadoop-slave1:~$
Hello My Lead Node
If it does not work, please double check whether your iptables rules (iptables, or ip6tables if you use IPv6) opens port 8649 for both UDP and TCP connections.
Let gmond send some data to another gmond
Install gmond on two nodes and verify if one can send its metrics to another using UDP connection on port 8649. You may use following settings in gmond.conf file for both nodes:
cluster {
  name = 'hadoop-slaves'
}
udp_send_channel {
  host = the.lead.node.IP.address
  port = 8649
}
udp_recv_channel {
  port = 8649
}
tcp_accept_channel {}
After running gmonds (sudo /etc/init.d/ganglia-monitor start), you can use lsof to check if the connection was established:
akawa@hadoop-slave1:~$ sudo lsof -i :8649
COMMAND   PID    USER   FD   TYPE    DEVICE SIZE/OFF NODE NAME
gmond   48746 ganglia    4u  IPv4 201166172      0t0  UDP *:8649
gmond   48746 ganglia    5u  IPv4 201166173      0t0  TCP *:8649 (LISTEN)
gmond   48746 ganglia    6u  IPv4 201166175      0t0  UDP hadoop-slave1:35702->hadoop-slave1:8649
akawa@hadoop-slave2:~$ sudo lsof -i :8649
COMMAND   PID    USER   FD   TYPE    DEVICE SIZE/OFF NODE NAME
gmond   31025 ganglia    6u  IPv4 383110679      0t0  UDP hadoop-slave2:60789->hadoop-slave1:8649
To see if any data is actually sent to the lead node, use tcpdump to dump network traffic on port 8649:
akawa@hadoop-slave1:~$ sudo tcpdump -i eth-pub udp port 8649
tcpdump: verbose output suppressed, use -v or -vv for full protocol decode
listening on eth-pub, link-type EN10MB (Ethernet), capture size 65535 bytes
18:08:02.236625 IP hadoop-slave2.60789 > hadoop-slave1.8649: UDP, length 224
18:08:02.236652 IP hadoop-slave2.60789 > hadoop-slave1.8649: UDP, length 52
18:08:02.236661 IP hadoop-slave2.60789 > hadoop-slave1.8649: UDP, length 236
Use debug option
tcpdump shows that some data is transferred, but it does not tell you what kind of data is sent. Hopefully, running gmond or gmetad in debugging mode gives us more information (since it does not run as a daemon in the debugging mode, so stop it simply using Ctrl+C)
akawa@hadoop-slave1:~$ sudo /etc/init.d/ganglia-monitor stop
akawa@hadoop-slave1:~$ sudo /usr/sbin/gmond -d 2

loaded module: core_metrics
loaded module: cpu_module
...
udp_recv_channel mcast_join=NULL mcast_if=NULL port=-1 bind=NULL
tcp_accept_channel bind=NULL port=-1
udp_send_channel mcast_join=NULL mcast_if=NULL host=hadoop-slave1.IP.address port=8649

	metric 'cpu_user' being collected now
	metric 'cpu_user' has value_threshold 1.000000
        ...............
	metric 'swap_free' being collected now
	metric 'swap_free' has value_threshold 1024.000000
	metric 'bytes_out' being collected now
 ********** bytes_out:  21741.789062
        ....
Counting device /dev/mapper/lvm0-rootfs (96.66 %)
Counting device /dev/mapper/360a980006467435a6c5a687069326462 (35.31 %)
For all disks: 8064.911 GB total, 5209.690 GB free for users.
	metric 'disk_total' has value_threshold 1.000000
	metric 'disk_free' being collected now
        .....
	sent message 'cpu_num' of length 52 with 0 errors
	sending metadata for metric: cpu_speed
We see that various metrics are collected and sent to host=hadoop-slave1.IP.address port=8649. Unfortunately, it only does not tell whether thy are delivered successfully since they were send over UDP…
Do not mix IPv4 and IPv6
Let’s have a look at a real situation, that we have encountered on our cluster (and which was the root cause of mysterious and annoying Ganglia misconfiguration). First, look at lsof results.
akawa@hadoop-slave1:~$ sudo  lsof -i :8649
COMMAND   PID    USER   FD   TYPE    DEVICE SIZE/OFF NODE NAME
gmond   38431 ganglia    4u  IPv4 197424417      0t0  UDP *:8649
gmond   38431 ganglia    5u  IPv4 197424418      0t0  TCP *:8649 (LISTEN)
gmond   38431 ganglia    6u  IPv4 197424422      0t0  UDP hadoop-slave1:58304->hadoop-slave1:864913:56:33
akawa@ceon.pl: akawa@hadoop-slave2:~$ sudo  lsof -i :8649
COMMAND   PID    USER   FD   TYPE    DEVICE SIZE/OFF NODE NAME
gmond   23552 ganglia    6u  IPv6 382340910      0t0  UDP hadoop-slave2:36999->hadoop-slave1:8649
Here hadoop-slave2 sends metrics to hadoop-slave1 on right port and hadoop-slave1 listens to on right port as well. Everything is almost the same as at the snippets in the previous section, except one important detail – hadoop-slave2 sends over IPv6, but hadoop-slave1 reads over IPv4! The initial guess was to update ip6tables (apart from iptables) rules to open port 8649 for both UDP and TCP connections over IPv6. But it did not work. It worked when we changed hostname “hadoop-slave1.vls” to its IP addess in gmond.conf files (yes, earlier I used hostnames instead of IP addresses in every file). Make sure, that your IP address is correctly resolved to a hostname, or vice versa.
Get cluster summary with gstat
If you managed to send send metrics from slave2 to slave1, it means your cluster is working. In Ganglia’s nomenclature, cluster is a set of hosts that share the same cluster name attribute in gmond.conf file e.g. “hadoop-slaves”. There is a useful provided by Ganglia called gstat that prints the list of hosts that are represented by a gmond running on a given node.
akawa@hadoop-slave1:~$ gstat --all
CLUSTER INFORMATION
       Name: hadoop-slaves
      Hosts: 2
Gexec Hosts: 0
 Dead Hosts: 0
  Localtime: Tue Aug 21 22:46:21 2012

CLUSTER HOSTS
Hostname                     LOAD                       CPU              Gexec
 CPUs (Procs/Total) [     1,     5, 15min] [  User,  Nice, System, Idle, Wio]
hadoop-slave2
   48 (    0/  707) [  0.01,  0.07,  0.09] [   0.1,   0.0,   0.1,  99.8,   0.0] OFF
hadoop-slave1
   48 (    0/  731) [  0.01,  0.06,  0.07] [   0.0,   0.0,   0.1,  99.9,   0.0] OFF
Check where gmetad polls metrics from
Run following command on the host that runs gmetad to check what clusters and host is it polling metrics from (you grep it somehow to display only useful lines):
akawa@hadoop-master:~$ nc localhost 8651 | grep hadoop

<GRID NAME='Hadoop_And_HBase' AUTHORITY='http://hadoop-master/ganglia/' LOCALTIME='1345642845'>
<CLUSTER NAME='hadoop-masters' LOCALTIME='1345642831' OWNER='ICM' LATLONG='unspecified' URL='http://ceon.pl'>
<HOST NAME='hadoop-master' IP='hadoop-master.IP.address' REPORTED='1345642831' TN='14' TMAX='20' DMAX='0' LOCATION='unspecified' GMOND_STARTED='1345632023'>
<CLUSTER NAME='hadoop-slaves' LOCALTIME='1345642835' OWNER='ICM' LATLONG='unspecified' URL='http://ceon.pl'>
<HOST NAME='hadoop-slave4' IP='...' REPORTED='1345642829' TN='16' TMAX='20' DMAX='0' LOCATION='unspecified' GMOND_STARTED='1345478489'>
<HOST NAME='hadoop-slave2' IP='...' REPORTED='1345642828' TN='16' TMAX='20' DMAX='0' LOCATION='unspecified' GMOND_STARTED='1345581519'>
<HOST NAME='hadoop-slave3' IP='...' REPORTED='1345642829' TN='15' TMAX='20' DMAX='0' LOCATION='unspecified' GMOND_STARTED='1345478489'>
<HOST NAME='hadoop-slave1' IP='...' REPORTED='1345642833' TN='11' TMAX='20' DMAX='0' LOCATION='unspecified' GMOND_STARTED='1345572002'>
Alternatives
Since the monitoring of clusters is quite broad topic, there are many tools that helps you with this task. In case of Hadoop clusters, apart from Ganglia, you can find a number of other interesting alternatives. I will just shortly mention a couple of them.
Cloudera Manager 4 (Enterprise)
Apart from greatly simplifing the process of installation and configuration of Hadoop cluster, Cloudera Manager provides a couple of useful features to monitor and visualize dozens of Hadoop’s service performance metrics and information related to hosts including CPU, memory, disk usage and network I/O. Additionally, it alerts you when you approach critical thresholds (Ganglia itself does not provide alerts, but can be integrated with alerting systems such as Nagios and Hyperic). You may learn more about the key features of Cloudera Manager here.
Cacti, Zabbix, Nagios, Hyperic
Please visit Cacti website to learn more about this tool. Here is also very interesting blog post about Hadoop Graphing with Cacti. Zabbix, Nagios and Hyperic are tools you may also want to look at.
Acknowledges
I would like to give big thanks to my colleagues Pawel Tecza and Artur Czeczko who helped me with configuring and debugging Ganglia on the cluster.
Reference: Ganglia configuration for a small Hadoop cluster and some troubleshooting from our JCG partner Adam Kawa at the Hakuna MapData! blog.




Hi,
I’ve followed this document to install ganglia in my cluster.i’ve one master node and two slave nodes.all are working fine but slave2 node is not added to slave1.
Please get rid of this problem.Thanks in advance
Regards,
Dilip
Great work! This is really helpful to me. Thank you:)