First rule of performance optimisation
Let’s start with a system with no obvious performance bottlenecks. By that I mean that there are no glaring algorithmic problems which are grinding your system to a halt. e.g. a tight loop which is reading a property from a file without caching the result.
You want your system to run as fast as possible, where do you start? Most profilers (e.g. my current favourite YourKit) have modules for memory tracing and CPU tracing. Since the aim of the exercise is for your program to run faster you start by looking at the CPU? – Wrong! The first place to start is by looking at the memory and in particular at object allocation.
What you should always try and do in first instance is to reduce your object allocations as much as possible. The reason that this is not intuitive (at least it wasn’t to me) was because we know that object allocation is fast, in fact it’s super fast even compared to languages like C. (Lots of discussion on the web about exactly which and in what circumstances it can be faster – but it’s undeniably fast). So, if object allocation is so fast why is it slowing my program down and why should I start by minimising my object allocation?
- It puts extra pressure on the garbage collector. Having more objects in the system (especially if they are not short lived) will give your garbage collector more work and slow down the system that way.
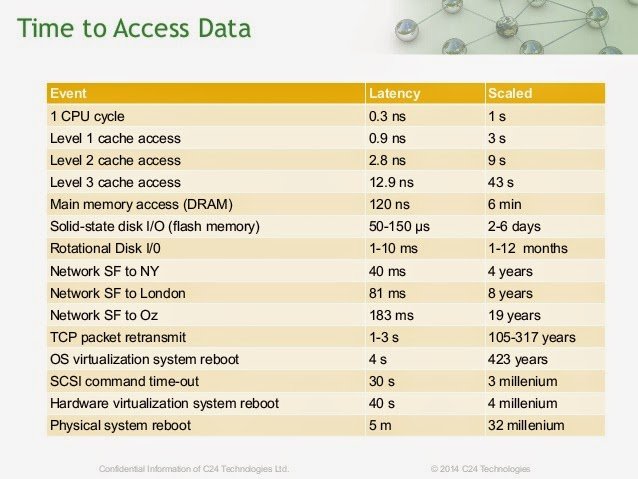
- It fills up your CPU caches with garbage forcing them to flush and have to keep going higher up the stack to L2 and L3 cache and then to main memory to retrieve the data. Roughly speaking, each level up the stack from which data has to fetched takes an order of magnitude longer in time (see graphic below). So even if object allocation is fast it causes cache misses and thus many wasted cpu cycles which will slow your program down.
- Do the easy things first. It’s far easier in general to reduce allocation (by caching etc) than it is fix algorithms when looking at a CPU performance trace. Changing the allocations may completely change the performance characteristics of your program and it may be that any changes to algorithms carried out prior to that will have been a waste of time.
- Profilers lie (this is a must watch video). It’s really hard to know, when looking at CPU traces where exactly the bottlenecks lie. Profilers however do not lie about the allocations.
- High object allocation is often a bad smell in the code. Looking for excess object allocation will lead you to algorithmic issues.
| Reference: | First rule of performance optimisation from our JCG partner Daniel Shaya at the Rational Java blog. |


