1. Introduction
These days numerous frameworks and libraries make it is pretty easy to get from literally nothing to a full-fledged running application or service in a matter of hours. It is really amazing and you may totally get away with that but more often than not the decisions which frameworks make on your behalf (often called “sensitive defaults”) are far from being optimal (or even sufficient) in the context of the specific application or service (and truth to be said, it is hardly possible to come up with one-size-fits-all solution).
In this section of the tutorial we are going to talk about performance and load testing, focusing on the tools to help you with achieving your goals and also highlight the typical areas of the application to tune. It is worth noting that some techniques may apply to one individual microservice but in most cases the emphasis should gravitate towards the entire microservice architecture ensemble.
Often enough the terms performance and load testing are used interchangeably, however this is a misconception. It is true that these testing techniques often come together but each of them sets different goals. The performance testing helps you to assess how fast the system under test is whereas the load testing helps you to understand the limits of the system under the test. These answers are very sensitive to the context the system is running in, so it is always recommended to design the simulations as close to production conditions as possible.
Table Of Contents
The methodology of the performance and load testing is left
out of this part of the tutorial since there are just too many things to cover
there. I would highly recommend the book Systems
Performance: Enterprise and the Cloud by Brendan Gregg to deeply understand
the performance and scalability aspects throughout the complete software stack.
2. Make Friends with JVM and GC
The success of the Java is largely indebted to its runtime (JVM) and automatic memory management (GC). Over the years JVM has turned into a very sophisticated piece of technology with a lot of things being built on top of it. This is why it is often referred as “JVM platform”.
There are two main open sourced, production-ready JVM implementations out there: HotSpot and Eclipse OpenJ9. Fairly speaking, HotSpot is in dominant position but Eclipse OpenJ9 is looking quite promising for certain kind of applications. The picture would be incomplete without mentioning the GraalVM, a high-performance polyglot VM, based on SubstrateVM. Picking the right JVM could be an easy win from the start.
With respect to memory management and garbage collection (GC), the things are much more complicated. Depending on the version of the JDK (8 or 11) and the vendor, we are talking about Serial GC, Parallel GC, CMS, G1, ZGC and Shenandoah. The JDK 11 release introduced an experimental Epsilon GC, which is effectively a no-op GC.
Tuning GC is an art and requires deep understanding on how JVM works. The JVM Anatomy Park is one of the best and up-to-date sources of the invaluable insights on JVM and GC internals. But how would you diagnose the problems in your applications and actually figure out what to tune?
To our luck, this is now possible with the help of two great tools, Java Mission Control and Java Flight Recorder, which have been open sourced as of the JDK 11 release. These tools are available for HotSpot VM only and are exceptionally easy to use, even in production.
Last but not least, let us talk for a moment about how the containerization (or better to say, Docker’ization) impacts the JVM behavior. Since the JDK 10 and JDK 8 Update 191 the JVM has been modified to be fully aware that it is running in a Docker container and is able to properly extract the allocated number of CPUs and total memory.
3. Microbenchmarks
Adjusting GC and JVM settings to the needs of your applications and services is difficult but rewarding exercise. However, it very likely will not help when JVM stumbles upon the inefficient code. More often than not the implementation has to be rewritten from the scratch or refactored, but how to make sure that it outperforms the old one? The microbenchmarking techniques backed by JHM tool are here to help.
JMH is a Java harness for building, running, and analysing nano/micro/milli/macro benchmarks written in Java and other languages targetting the JVM. – https://openjdk.java.net/projects/code-tools/jmh/
You may be wondering why use the dedicated tool for that? In the nutshell, the benchmarking looks easy, just run the code in question in a loop and measure the time, right? In fact, writing the benchmarks which properly measure the performance of the reasonably small parts of the application is very difficult, specifically when JVM is involved. There are many optimizations which JVM could apply taking into the account the much smaller scope of the isolated code fragments being benchmarked. This is the primary reason you need the tools like JHM which is aware of the JVM behavior and guides you towards implementing and running the benchmark correctly, so you would end up with the measurements you could trust.
The JHM repository has a large number of samples to look at and derive your own, but if you want to learn more on the subject, Optimizing Java: Practical Techniques for Improving JVM Application Performance by Benjamin J Evans, James Gough and Chris Newland is a terrific book to look into.
Once you master the JHM and start to use it day by day, the comparison of the microbenchmarks may become a tedious process. The JMH Compare GUI is a small GUI tool which could help you to compare these results visually.
4. Apache JMeter
Let us switch gears from micro- to macrobenchmarking and talk about measuring the performance of the applications and services deployed somewhere. The first tool we are going to look at is Apache JMeter, probably one of the oldest tools in this category.
The Apache JMeter application is open source software, a 100% pure Java application designed to load test functional behavior and measure performance. It was originally designed for testing Web Applications but has since expanded to other test functions. – https://jmeter.apache.org/
Apache JMeter advocates the UI-based approach to create and manage quite sophisticated test plans. The UI itself is pretty intuitive and it won’t take long to have your first scenario out. One of the strongest sides of the Apache JMeter is high level of extensibility and scripting support.
The Reservation Service is a core of the JCG Car Rentals platform, so the screenshot below gives a sneak peak on the simple test plan against reservation RESTful API.

Apache JMeter
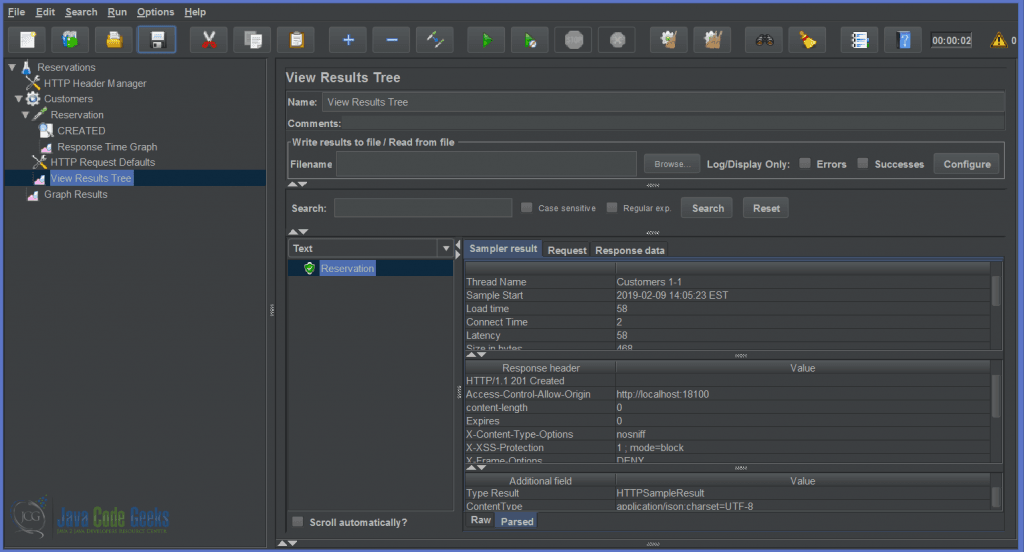
The presence of the user-friendly interface is great for humans but not for automated tooling. Luckily, the Apache JMeter test plans could be run from command line, using Apache Maven plugin, Gradle plugin or even embedded into the application test harness.
The ability to be easily injected into continuous integration pipelines makes Apache JMeter a great fit for developing automated load and performance test scenarios.
5. Gatling
There are quite a few load testing frameworks which promote the code-first approach to test scenarios, with Gatling being one of the best examples.
Gatling is a highly capable load testing tool. It is designed for ease of use, maintainability and high performance. – https://gatling.io/docs/current/
The Gatling scenarios are written in Scala but this aspect is abstracted away behind the concise DSL, so the knowledge of Scala is desired although not required. Let us re-implement the Apache JMeter test scenario for Reservation Service using Gatling code-first approach.
class ReservationSimulation extends Simulation {
  val tokens: Map[String, String] = TrieMap[String, String]()
  val customers = csv("customers.csv").circular()

  val protocol = http
    .baseUrl("http://localhost:17000")
    .contentTypeHeader("application/json")

  val reservation = scenario("Simulate Reservation")
    .feed(customers)
    .doIfOrElse(session => tokens.get(session("username").as[String]) == None) {
      KeycloakToken
        .token
        .exec(session => {
          tokens.replace(session("username").as[String], session("token").as[String])
          session
        })
    } {
      exec(session => {
        tokens.get(session("username").as[String]).fold(session)(session.set("token", _))
      })
    }
    .exec(
      http("Reservation Request")
        .post("/reservations")
        .header("Authorization", "Bearer ${token}")
        .body(ElFileBody("reservation-payload.json")).asJson
        .check(status.is(201)))

  setUp(
    reservation.inject(rampUsers(10) during (20 seconds))
  ).protocols(protocol)
}
The test scenario, or in terms of Gatling, simulation, is pretty easy to follow. A minor complication arises from the need to obtain the access token using the Keycloak APIs but there are several ways to resolve it. In the simulation above we made it a part of the reservation flow backed by in-memory token cache. As you could see, complex, multi-step simulations are looking easy in Gatling.
The reporting side of Gatling is really amazing. Out of the box you get the simulation results in a beautiful HTML markup, the picture below is just a small fragment of it. You could also extract this data from the simulation log file and interpret it in the way you need.

From the early days Gatling was designed for continuous load testing and integrates very well with Apache Maven, SBT, Gradle, and continuous integration pipelines. There are a number of extensions available to support wide variety of the protocols (and you are certainly welcome to contribute there).

6. Command-Line Tooling
The command line tools are probably the fastest and most straightforward way to put some load on your services and get this so needed feedback quickly. We are going to start with Apache Bench (better known as ab), a tool for benchmarking HTTP-based services and applications.
For example, the same scenario for the Reservation Service we have seen in the previous sections could be load tested using ab, assuming the security token has been obtained before.
$ ab -c 5 -n 1000 -H "Authorization: Bearer $TOKEN" -T "application/json" -p reservation-payload.json  http://localhost:17000/reservations

This is ApacheBench, Version 2.3
Copyright 1996 Adam Twiss, Zeus Technology Ltd, http://www.zeustech.net/
Licensed to The Apache Software Foundation, http://www.apache.org/

Benchmarking localhost (be patient)
...
Completed 1000 requests
Finished 1000 requests

Server Software:
Server Hostname:        localhost
Server Port:            17000

Document Path:          /reservations
Document Length:        0 bytes

Concurrency Level:      5
Time taken for tests:   22.785 seconds
Complete requests:      1000
Failed requests:        0
Total transferred:      487000 bytes
Total body sent:        1836000
HTML transferred:       0 bytes
Requests per second:    43.89 [#/sec] (mean)
Time per request:       113.925 [ms] (mean)
Time per request:       22.785 [ms] (mean, across all concurrent requests)
Transfer rate:          20.87 [Kbytes/sec] received
                        78.69 kb/s sent
                        99.56 kb/s total

Connection Times (ms)
              min  mean[+/-sd] median   max
Connect:        0    0   0.4      0       1
Processing:     6  113 449.4     27    4647
Waiting:        5  107 447.7     19    4645
Total:          6  114 449.4     28    4648

Percentage of the requests served within a certain time (ms)
  50%     28
  66%     52
  75%     57
  80%     62
  90%     83
  95%    326
  98%   1024
  99%   2885
 100%   4648 (longest request)
When the simplicity of ab becomes a show stopper, you may look at wrk, a modern HTTP benchmarking tool. It has power scripting support, baked by Lua, and is capable of simulating the complex load scenarios.
$ wrk -s reservation.lua -d60s -c50 -t5 --latency -H "Authorization: Bearer $TOKEN" http://localhost:17000/reservations

Running 1m test @ http://localhost:17000/reservations
  5 threads and 50 connections
  Thread Stats   Avg      Stdev     Max   +/- Stdev
    Latency   651.87ms   93.89ms   1.73s    85.20%
    Req/Sec    16.94     10.00    60.00     71.02%
  Latency Distribution
     50%  627.14ms
     75%  696.23ms
     90%  740.52ms
     99%    1.02s
  4579 requests in 1.00m, 2.04MB read
Requests/sec:     76.21
Transfer/sec:     34.83KB
If scripting is not something you are willing to use, there is another great option certainly worth mentioning, vegeta, a HTTP load testing tool (and library). It has enormous amount of features and even includes out of the box plotting.
$ echo "POST http://localhost:17000/reservations" | vegeta attack -duration=60s -rate=20 -header="Authorization: Bearer $TOKEN" -header="Content-Type: application/json" -body reservation-payload.json > results.bin
Once the corresponding load test results are stored (in our case, in the file called results.bin), they could be easily converted into textual report:
$ cat results.bin | vegeta report

Requests      [total, rate]            1200, 20.01
Duration      [total, attack, wait]    59.9714976s, 59.9617223s, 9.7753ms
Latencies     [mean, 50, 95, 99, max]  26.286524ms, 9.424435ms, 104.754362ms, 416.680833ms, 846.8242ms
Bytes In      [total, mean]            0, 0.00
Bytes Out     [total, mean]            174000, 145.00
Success       [ratio]                  100.00%
Status Codes  [code:count]             201:1200
Error Set:
Or just converted into the graphical chart representation:
$ cat results.bin | vegeta plot

As we have seen, each of these command line tools fits to the different needs you may have in mind for a particular load or performance scenario. Although there are many others out there, those three are pretty safe choices to pick from.
7. What about gRPC? HTTP/2? TCP?
All of the tools we have talked about so far support performance testing of the HTTP-based web services and APIs from the get-go. But what about stressing the services which rely on gRPC, HTTP/2 or even plain old UDP protocols?
Although there is no magic Swiss Army knife kind of tool yet, there are certainly some options. For example, Gatling has HTTP/2 support built-in since the 3.0.0 release, whereas gRPC and UDP are supported by community extensions. From the other side, vegeta has HTTP/2 support whereas Apache JMeter has SMTP, FTP and TCP support.
Digging into specifics, there is official gRPC benchmarking guide which summarizes the performance benchmarking tools, the scenarios considered by the tests, and the testing infrastructure for gRPC-based services.
8. More Tools Around Us
Beside the tools and frameworks we have discussed up to now, it worth mentioning a few other choices which are great but might not be native for the Java developers. The first one is Locust, an easy-to-use, distributed, scalable load testing framework written in Python. The second one is Tsung, an open-source multi-protocol distributed load testing tool written in Erlang.
One of the promising projects to watch for is Test Armada, a fleet of tools empowering developers to implement quality automation at scale, which is also on track to introduce the support of the performance testing (based off Apache JMeter).
And it will be unfair to finish up without talking about Grinder, one of the earliest Java load testing framework that makes it easy to run a distributed test using many load injector machines. Unfortunately, the project seems to be dead, without any signs of the development for the last few years.
9. Microservices for Java Developers: Performance and Load Testing – Conclusions
In this part of the tutorial we have talked about the tools, techniques and frameworks for performance and load testing, specifically in the context of the JVM platform. It is very important to take enough time, set the goals upfront and design the realistic performance and load test scenarios. This is a discipline by itself, but most importantly, the outcomes of these simulations could guide the service owners to properly shape out many SLA aspects we discussed before.
10. What’s next
In the next section if the tutorial we are going to wrap up the discussion related to testing the microservices by focusing on the tooling around the security testing.
The samples and sources for this section are available for download here.

Sensitive defaults… :-) Sensible defaults is the correct term I think.
You are very right, a typo here, thank you.