Prometheus is an open-source monitoring and alerting system that is widely used for monitoring containerized applications and microservices. A Prometheus Workshop is an event or training session that focuses on teaching individuals and teams how to use and leverage Prometheus for monitoring and alerting in their own environments.
During a Prometheus workshop, participants typically learn about Prometheus architecture, metric types, instrumentation, exporters, querying and alerting, and best practices for deploying Prometheus in production. They may also learn about related tools and technologies such as Grafana for visualization, Kubernetes for container orchestration, and Service Mesh for service-to-service communication.
Prometheus workshops can be conducted in-person or online, and can be tailored to different skill levels and use cases, from beginners to advanced users. Many organizations and communities offer Prometheus workshops as part of their training programs, conferences, or community events.
1. Why Use Prometheus
There are several reasons why individuals and organizations may choose to attend a Prometheus Workshop:
- Learn a widely used monitoring and alerting tool: Prometheus is a popular and widely used tool for monitoring containerized applications and microservices. Attending a Prometheus Workshop can help individuals and teams learn how to use Prometheus effectively and leverage its features to monitor their own environments.
- Stay up-to-date with industry best practices: Prometheus is an evolving technology, with new features and best practices emerging over time. Attending a Prometheus Workshop can help individuals and teams stay up-to-date with the latest developments and best practices in the field.
- Gain hands-on experience: Many Prometheus Workshops include hands-on exercises and labs, which can help participants gain practical experience working with the tool in a real-world setting.
- Network with peers: Prometheus Workshops can also provide opportunities to network with other individuals and teams who are working with Prometheus or other related technologies, which can lead to new insights, collaborations, and career opportunities.
Overall, attending a Prometheus Workshop can help individuals and teams develop the skills and knowledge needed to effectively monitor and manage modern, containerized applications and microservices.
2. Prometheus Basic Architecture
The Prometheus architecture consists of four main components:
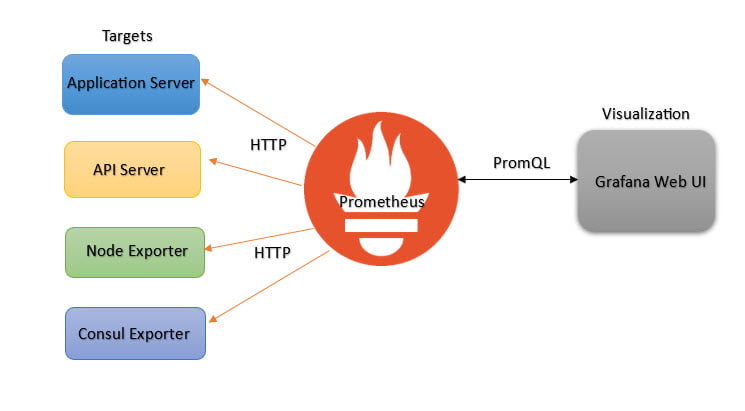
- Prometheus server: The Prometheus server is responsible for collecting and storing metrics data from various sources. It uses a time-series database to store the collected data and provides a web UI and an API for querying and visualization.
- Data sources: Prometheus can collect metrics data from various sources such as exporters, client libraries, and service discovery systems. Exporters are agents that run on the target systems and expose metrics data in a format that can be scraped by Prometheus. Client libraries are used to instrument applications and services to expose metrics data directly to Prometheus. Service discovery systems such as Kubernetes or Consul can be used to automatically discover and scrape metrics from services.
- Alertmanager: The Alertmanager is responsible for handling alerts generated by Prometheus. It can group, deduplicate, and route alerts to different receivers such as email, Slack, or PagerDuty.
- Exporters: Exporters are agents that run on the target systems and expose metrics data in a format that can be scraped by Prometheus. There are many exporters available for different systems and services, such as Node Exporter for Linux hosts, Blackbox Exporter for probing endpoints, and Kubernetes Exporter for monitoring Kubernetes clusters.
The basic architecture of Prometheus is designed to be highly scalable, reliable, and flexible, and it provides a robust and powerful monitoring solution for modern, containerized applications and microservices.
3. Prometheus Popular Questions and Answers
Q: What is Prometheus?
Prometheus is an open-source monitoring and alerting system, designed for monitoring modern, containerized applications and microservices.
Q: What does Prometheus do?
Prometheus collects and stores metrics data from various sources, provides a powerful query language for analyzing and visualizing the data, and can generate alerts based on predefined rules and thresholds.
Q: What kind of metrics can Prometheus collect?
Prometheus can collect various kinds of metrics data such as system-level metrics (CPU usage, memory usage, disk usage), application-level metrics (request latency, error rates, throughput), and custom metrics defined by users.
Q: How does Prometheus collect metrics data?
Prometheus can collect metrics data from various sources such as exporters, client libraries, and service discovery systems. Exporters are agents that run on the target systems and expose metrics data in a format that can be scraped by Prometheus. Client libraries are used to instrument applications and services to expose metrics data directly to Prometheus. Service discovery systems such as Kubernetes or Consul can be used to automatically discover and scrape metrics from services.
Q: What query language does Prometheus use?
Prometheus uses a powerful query language called PromQL (Prometheus Query Language), which allows users to select, filter, aggregate, and transform metrics data in real-time.
Q: What is Alertmanager in Prometheus?
A: Alertmanager is a component in Prometheus that is responsible for handling alerts generated by Prometheus. It can group, deduplicate, and route alerts to different receivers such as email, Slack, or PagerDuty.
Q: What are exporters in Prometheus?
Exporters are agents that run on the target systems and expose metrics data in a format that can be scraped by Prometheus. There are many exporters available for different systems and services, such as Node Exporter for Linux hosts, Blackbox Exporter for probing endpoints, and Kubernetes Exporter for monitoring Kubernetes clusters.
Q: Is Prometheus suitable for large-scale monitoring?
Yes, Prometheus is designed to be highly scalable and can handle large-scale monitoring of thousands of targets and millions of metrics. It provides various features such as sharding, federation, and remote storage to support large-scale deployments.
Q: What is a PromQL?
PromQL is the query language used by Prometheus to retrieve and analyze metrics data. It supports a wide range of operations such as filtering, aggregation, and mathematical operations.
Q: What is the role of alerting in Prometheus?
Alerting in Prometheus is used to notify users when certain conditions are met, such as when a metric value exceeds a certain threshold or when a service is down. Prometheus provides a flexible alerting system that allows users to define their own alert rules and notification channels.
Q: How does Prometheus ensure high availability?
Prometheus uses a multi-server architecture with replicas to ensure high availability. It also provides features such as sharding and federation to enable distributed monitoring across multiple clusters.
Q: What are some best practices for using Prometheus?
Some best practices for using Prometheus include: properly instrumenting applications, using labels to provide context, defining meaningful alerts, regularly reviewing and optimizing queries, and using Prometheus in conjunction with other monitoring tools.
Q: Can Prometheus monitor non-containerized workloads?
Yes, Prometheus can monitor non-containerized workloads such as virtual machines and bare-metal servers. It can collect metrics from any target that exposes them in a format that Prometheus understands.
Q: How does Prometheus compare to other monitoring tools?
Prometheus is known for its scalability, flexibility, and ease of use. It has a powerful query language and a vibrant community that provides a wide range of integrations and plugins. Compared to other monitoring tools, Prometheus is often considered a better fit for containerized environments and cloud-native architectures.
4. How to install and set up Prometheus on your own local machine
To install and set up Prometheus on your local machine, you can follow these general steps:
- Download the latest version of Prometheus from the official website (https://prometheus.io/download/).
- Extract the downloaded archive to a directory of your choice.
- Navigate to the extracted directory and open the
prometheus.ymlconfiguration file. - Modify the configuration file to specify the targets you want to monitor. For example, you can add the following lines to monitor a local web server:
- job_name: 'local-webserver'
    static_configs:
      - targets: ['localhost:8080']
- Save the configuration file and start Prometheus by running the following command from the extracted directory:
./prometheus --config.file=prometheus.yml
- Prometheus should now be running on
http://localhost:9090. You can access the Prometheus web UI by opening a web browser and navigating to that URL. - Use the query language, PromQL, to query and visualize the metrics collected by Prometheus. For example, you can enter the following query in the “Expression” field to display the HTTP requests per second:
rate(http_requests_total[1m])
That’s it! You have now installed and set up Prometheus on your local machine.
5. Conclusion
Prometheus is a powerful monitoring and alerting tool that can help you gain insights into the health and performance of your applications and infrastructure. In this workshop, we covered the basics of Prometheus, including how it collects and stores metrics, how to use the PromQL query language to analyze the data, and how to set up alerts to notify you of critical issues.
We also covered some best practices for using Prometheus, such as properly instrumenting your applications, using labels to provide context, and regularly reviewing and optimizing your queries.
By the end of this workshop, you should have a good understanding of how Prometheus works and how to use it to monitor and troubleshoot your own applications and infrastructure. Remember that Prometheus is just one tool in a larger monitoring and observability ecosystem, and it is often used in conjunction with other tools such as Grafana, alert managers, and logging systems.
Keep learning and experimenting with Prometheus, and you’ll be well on your way to building a robust and reliable monitoring and observability solution for your organization.
