Profile your applications with Java VisualVM
One profiler, packed by default with the Sun JDK is Java VisualVM. This profiler is really simple to use and really powerful.
 In this post, we’ll see how to install it and use it to profile an application.
Normally, to install it, you have nothing to do, because, it’s installed with the JDK. But in several Unix system, like Ubuntu, this is not the case. If you want to install it, just use apt-get (or aptitude) :
sudo apt-get install visualvm
To launch it just launch jvisualvm (jvisualvm.exe in the bin directory of the jdk for Windows).
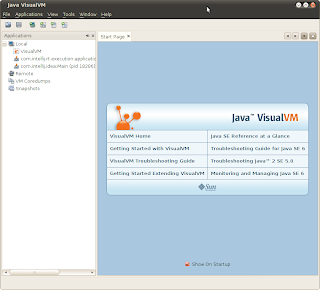
That will open the following window :
There is not a lot of interesting things to see here. To profile a application, you just have to launch it and VisualVM will detect it as launched :
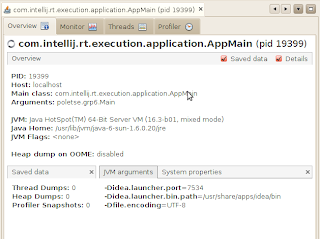
After that, you just have to double click to view information about your running application. You’ve four tabs available for your applications (Overview, Monitor, Threads, Profiler). We’ll see all that 4 tabs. First of all, the default tab, the overview :
This tab contains the main informations about the launched application. You can see the main class, the arguments of the command line, the JVM arguments. You can also see what kind of JVM is running your program and where the JVM is located. And you can see all the properties set in the program.
A more interesting tab is the “Monitor” tab :
This tab follow the CPU and Memory usages of your applications. You have 4 graphs in this view. The first one, from left to right, up to down, display the CPU usage and the Garbage Collector CPU usage. The second graph display the usage of the heap space and the PermGen space. The next graph display the total number of classes loaded in the application and the last one displays the number of threads currently running. With these graphs, you can see if your application take too CPU or if there is too memory used by the application.
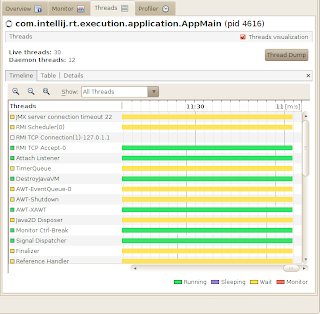
The third tab provide some details about Threads :
In this view, you can see how the different threads of the application are changing state and how they evolve. You can also see the time each time pass in each state and you can have details about the threads you want.
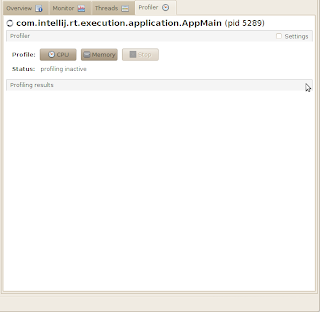
And now, I think the most interesting tab, is the Profiler one :
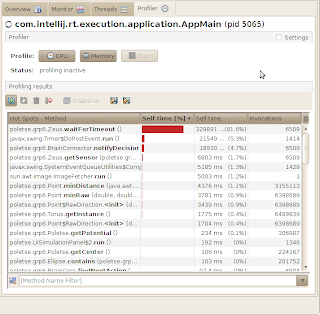
When you open this tab first, it contains no information at all. You must start one kind of profiling before seeing informations. We’ll start with CPU profiling. Just click on the CPU button the instrumentation will start. During the instrumentation, the application will be blocked. After the instrumentation, you can access the application again and you will see the results of the profiling be displayed in the table. Of course the profiling has an overhead on your application. Normally it’s not visible, but for certain applications, you can loose a lot of fluidity. Here are the results I have obtained with my simple application :
In my example, we can see that the waitForTimeout method takes 81.6% of the CPU time. We can also see that the notifyDecision and getSensor methods are the two next most CPU consuming methods, perhaps, it will be interesting to optimize them. You can also look at the number of invocations of each, perhaps, you’ll find a method that is invoked too much time.
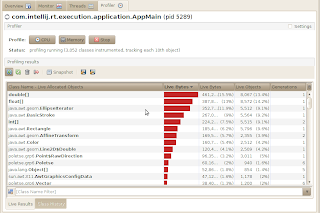
The next profiling we can do is the Memory profiling. Here again, you have to start the profiling and the instrumentation will start and during this, the application will be frozen. Here are the results for my application :
Here we can see that this application store some big double[] and float[] arrays and that EllipseIterator and BasicStroke classes take also a lot of memory spaces.
In both the memory and CPU profiling, you can save the results to a file to see it later. By example, you can let an application working the all night, save the results the morning and examine them or make three profiling and compare the three.
To conclude, I have to say that this profiler is really simple but also really powerful to use. We’ve the main features we want for a profiler and the results are really good. That kind of tools can really help you to improve an application to use less CPU and memory. Of course that kind of tool doesn’t do everything, it just help showing what part of the application must be improved, the improvement part is the task of the developer and it’s not the easiest one. But having that kind of tool is a good start.
Reference: Profile your applications with Java VisualVM from our JCG partner Baptiste Wicht at the @Blog(“Baptiste Wicht”).
Related Articles :





This is a great go to when you can’t install JProfiler. Not as indepth as a standalone profiler, like JProfiler, but for free you can’t beat it!
Hi, I think this is a very usefull tool, but actually I don’t know how to activate it, when I start de JVisualVM and after my target app, JVisualVM detects it fine, however when I open the app I cannot see the Profiler. By reading the doc at Oracle’s site, it says that by default the profiler it’s not running, then, how can activate it?? Thanks a lot by your return.