BTrace: hidden gem in Java developer toolbox
Shortly, the tool allows to inject tracing points without restarting or reconfiguring your Java application while it’s running. Moreover, though there are several ways to do that, the one I would like to discuss today is using JVisualVM tool from standard JDK bundle.
What is very cool, BTrace itself uses Java language to define injection trace points. The approach looks very familiar if you ever did aspect-oriented programming (AOP).
So let’s get started with a problem: we have an application which uses one of the NoSQL databases (f.e., let it be MongoDB) and suddenly starts to experience significant performance slowdown. Developers suspect that application runs too many queries or updates but cannot say it with confidence. Here BTrace can help.
First thing first, let’s run JVisualVM and install BTrace plugin:
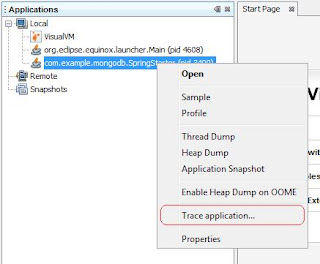
JVisualVM should be restarted in order for plugin to appear. Now, while our application is up and running, let’s right click on it in JVisualVM applications tree:
The following very intuitive BTrace editor (with simple toolbar) should appear:
This is a place where tracing instrumentation could be defined and dynamically injected into the running application. BTrace has a very rich model in order to define what exactly should be traced: methods, constructors, method returns, errors, …. Also it supports aggregations out of the box so it quite easy to collect a bunch of metrics while application is running. For our problem, we would like to see which methods related to MongoDB are being executed.
As my application uses Spring Data MongoDB, I am interested in which methods of any implementation of org.springframework.data.mongodb.core.MongoOperations interface are being called by application and how long every call takes. So I have defined a very simple BTrace script:
import com.sun.btrace.*;
import com.sun.btrace.annotations.*;
import static com.sun.btrace.BTraceUtils.*;

@BTrace
public class TracingScript {
    @TLS private static String method;

    @OnMethod(
        clazz = '+org.springframework.data.mongodb.core.MongoOperations',
        method = '/.*/'
    )
    public static void onMongo(
            @ProbeClassName String className,
            @ProbeMethodName String probeMethod,
            AnyType[] args ) {
        method = strcat( strcat( className, '::' ), probeMethod );
    }

    @OnMethod(
        clazz = '+org.springframework.data.mongodb.core.MongoOperations',
        method = '/.*/',
        location = @Location( Kind.RETURN )
    )
    public static void onMongoReturn( @Duration long duration ) {
         println( strcat( strcat( strcat( strcat( 'Method ', method ),
            ' executed in ' ), str( duration / 1000 ) ), 'ms' ) );
    }
}
Let me explain briefly what I am doing here. Basically, I would like to know when any method of any implementation of org.springframework.data.mongodb.core.MongoOperations is called (onMongo marks that) and duration of the call (onMongoReturn marks that in turn). Thread-local variable method holds full qualified method name (with a class), while thanks to useful BTrace predefined annotation, duration parameter holds the method execution time (in nanoseconds). Though it’s pure Java, BTrace allows only small subset of Java classes to be used. It’s not a problem as com.sun.btrace.BTraceUtils class provides a lot of useful methods (f.e., strcat) to fill the gaps. Running this script produces following output:
** Compiling the BTrace script ...
*** Compiled
** Instrumenting 1 classes ...
Method org.springframework.data.mongodb.core.MongoTemplate::maybeEmitEvent executed in 25ms
Method org.springframework.data.mongodb.core.MongoTemplate::maybeEmitEvent executed in 3ms
Method org.springframework.data.mongodb.core.MongoTemplate::getDb executed in 22ms
Method org.springframework.data.mongodb.core.MongoTemplate::prepareCollection executed in 2ms
Method org.springframework.data.mongodb.core.MongoTemplate::prepareCollection executed in 19ms
Method org.springframework.data.mongodb.core.MongoTemplate::access$100 executed in 2ms
Method org.springframework.data.mongodb.core.MongoTemplate::access$100 executed in 1ms
Method org.springframework.data.mongodb.core.MongoTemplate::maybeEmitEvent executed in 3ms
Method org.springframework.data.mongodb.core.MongoTemplate::maybeEmitEvent executed in 2ms
Method org.springframework.data.mongodb.core.MongoTemplate::getDb executed in 2ms
Method org.springframework.data.mongodb.core.MongoTemplate::prepareCollection executed in 1ms
Method org.springframework.data.mongodb.core.MongoTemplate::prepareCollection executed in 6ms
Method org.springframework.data.mongodb.core.MongoTemplate::access$100 executed in 1ms
Method org.springframework.data.mongodb.core.MongoTemplate::access$100 executed in 0ms
Method org.springframework.data.mongodb.core.MongoTemplate::maybeEmitEvent executed in 2ms
Method org.springframework.data.mongodb.core.MongoTemplate::maybeEmitEvent executed in 1ms
Method org.springframework.data.mongodb.core.MongoTemplate::getDb executed in 2ms
Method org.springframework.data.mongodb.core.MongoTemplate::prepareCollection executed in 1ms
Method org.springframework.data.mongodb.core.MongoTemplate::prepareCollection executed in 6ms
Method org.springframework.data.mongodb.core.MongoTemplate::access$100 executed in 1ms
Method org.springframework.data.mongodb.core.MongoTemplate::access$100 executed in 0ms
Method org.springframework.data.mongodb.core.MongoTemplate::maybeEmitEvent executed in 2ms
Method org.springframework.data.mongodb.core.MongoTemplate::maybeEmitEvent executed in 1ms
...
As you can see, output contains bunch of inner classes which could easily be eliminated by providing more precise method name templates (or maybe even tracing MongoDB driver instead).
I have just started to discover BTrace but I definitely see a great value for me as a developer from using this awesome tool.
Reference: BTrace: hidden gem in Java developer toolbox from our JCG partner Andrey Redko at the Andriy Redko {devmind} blog.


very interesting article and thanks for discowering
BTrace! I have downloaded plugin but no item “Trace application” appears in context menu. Should I download BTrace separately and set some system variables or it should work out of the box?
same problem here, btrace option is not showing up