Java VM – Beware of the YoungGen space
As you may have seen from our previous performance oriented articles, a healthy JVM is one of the most important goals to achieve for optimal application performance and stability. Such health assessment is very often only focusing on the frequency (avoidance) of major collections or detecting the presence of memory leaks. What about the sizing and footprint of the Young Generation space or short lived objects?
This article is based on a true story and a recent troubleshooting experience we had with one of our IT clients. It will demonstrate, through a sample application, that an excessive memory footprint and frequency of minor collections can trigger performance problems as severe as its bigger brother, the Old Generation or tenured space.
JVM health diagnostic
If you are new to the JVM tuning world, you will soon realize that there are no universal solutions applicable for all applications. Regardless of the high quality material that you may find from the Web from various sources, you still need to do your due diligence and properly understand the type of application that you are dealing with, including its sensitivity to JVM GC pauses (some application requires very low JVM pause time < 1%).
Java profiling (including memory leak detection) along with performance & load testing are good examples of extra work that you will need to perform in order to gather all proper data and facts about your application memory footprint and JVM runtime health.
That being said, what do we mean by a “healthy” JVM? Please answer the following questions on the best of your knowledge.
** If you answer NO, please assume a confidence level of 90%+, otherwise answer I DON’T KNOW.
- Is your Java heap or OldGen space leaking over time (after major collections)?
- Is your application currently affected by large and/or frequent JVM GC pauses?
- Is you JVM overall pause time higher than 5% or higher than an established ideal baseline?
- Is your application response time currently affected by the JVM GC activity on a regular basis and beyond the application tolerance point?
- Did you observe over the last 3 months occurrences of java.lang.OutOfMemoryError errors?
- Did you observe over the last 3 months occurrences of JVM crashes (sudden JVM failure with core dump & crash report)?
- Do you believe that your JVM is currently unstable and/or requires too much human intervention (regular restart etc.)?
If you answered YES or I DON’T KNOW to any of those, this means that you or your production performance tuning team have some work to do here, including a review of the current JVM GC policy.
If you answered NO to all of those with high confidence level, it means that you have likely achieved a solid application and JVM stability, congratulation. I still recommend that you re-assess the situation in between major releases and incremental load forecasts.
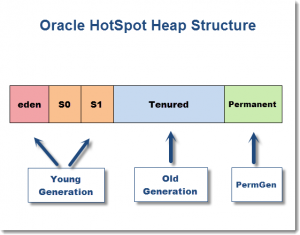
Young Generation: Stop the world, really?
As we saw from the quick JVM health assessment exercise, one of the points refers to the JVM overall pause time. This essentially means how much time the JVM is spending during the “stop the world” events. During such periods, application threads are suspended and not performing any work, increasing response time of your application. This metric is crucial since large JVM pauses will trigger unstable and unpredictable response times.
One common misperception that I have seen over the last few years is that YoungGen or minor collections are fully transparent and not effecting the application response time. This statement could almost be true if your Java heap size is small (YG space < 1 GB) and dealing with moderate short lived objects footprint or allocation rate. In this scenario, if the minor collections are executed very fast (< 20 ms) and not too frequently (every 30 seconds+), the overall JVM pause time contributed by the YoungGen space will remain small (<< 1%). However, the situation can change very quickly if the YG memory allocation rate increases (increased footprint per request, traffic surge etc.).
I recommend the following articles for more details about the YoungGen space and concurrent collectors available for the HotSpot JVM.
# Oracle HotSpot mostly concurrent collectors: CMS vs. G1
# Oracle HotSpot minor collections exhaustive coverage
- http://www.oracle.com/technetwork/java/javase/gc-tuning-6-140523.html
- http://blog.griddynamics.com/2011/06/understanding-gc-pauses-in-jvm-hotspots_02.html
Regardless of the HotSpot GC policy that you are using, including the mostly concurrent collectors such as CMS or G1, the YoungGen space collection remains a “stop the world” event. To our knowledge, Azul Zing C4 is the only JVM collector advertised as a true continuously concurrent compacting collector. We did not have a chance to experiment with this collector at this point. I welcome anyone with C4 tuning experience to share their observations, especially true fact figures vs. mostly concurrent collectors such as G1.
Now that we covered some of the theory, let’s deep dive into our sample application and review the performance testing results against various YoungGen footprint and allocation rates.
Sample application specifications
In order to compare the responsiveness and JVM pause time % between various YG allocation rates, we created a sample application as per below specifications:
- A JAX-RS (REST) Web Service was created and exposed via the jvm URI as per below attributes.
 @GET
    @Path("/jvm")
    @Produces(MediaType.APPLICATION_JSON)
    public Integer jvm() {}
Each invocation of jvm is performing the following logic:
1. Allocate a pre-determined size of short-lived objects (eligible for fast YG GC).
In addition, an initial memory footprint of 1 GB of long-lived objects (not eligible for GC) is allocated at class loading time in order to create some noise for the CMS collector.
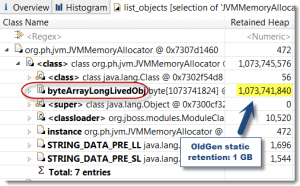
The YG short lived objects memory allocation and OldGen static retention was simply achieved through the creation of a static array of primitive byte values as per below code snippet. The true memory footprint can be observed as per the JVM heap dump analysis using MAT.
 private final static int LONG_LIVED_OBJ_FOOTPRINT = (1024 * 1024 * 1024);
private final static int SHORT_LIVED_OBJ_FOOTPRINT = (100 * 1024 * 1024);

// 1 GB static memory footprint
private final static byte byteArrayLongLivedObj[] = new byte[LONG_LIVED_OBJ_FOOTPRINT];

// 100 MB memory allocation (waste) created per execution
public void generateShortLivedObj(String objId) {
  byte byteArrayShortLivedObj[] = new byte[SHORT_LIVED_OBJ_FOOTPRINT];
}
Finally, find below the environment specifications and software’s used to create, execute and monitor this YG comparison performance testing.
- OS: Windows 7 @64-bit
- Java EE container: WildFly 8 Beta1
- JVM: Oracle HotSpot 1.7 @64-bit with a Java heap size of 5 GB (YG space: 1152 MB XX:NewRatio=3). GC collector: CMS
- IDE: JBoss Developer Studio 7.0.0.GA
- JVM monitoring: JVisualVM
- JVM memory leak analyzer: Plumbr 3.0
- JVM verbose:gc log analyzer: GCMV
- Performance & load testing: Apache JMeter 2.9
Performance testing results and observations
The following performance testing simulated a real life application that was dealing with high JVM pause time and severe degradation under peak load. 3 runs were executed, one for the baseline, and 2 runs after simulating improvements (reduction) of the application memory footprint per request.
Baseline
- 10 concurrent threads
- 100 MB of short lived objects created per execution per JVM process
The short lived objects memory footprint may look extreme but this is indeed what we were dealing with initially.
Results
- Average response time: 140 ms
- Throughput: 68 req / sec
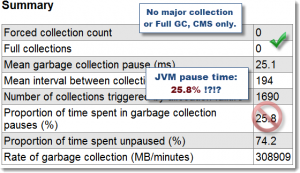
- JVM overall pause time: 25.8%
- YG collection frequency: 7 collections per second
- Rate of GC: 308 909 MB per minute
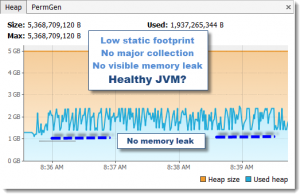
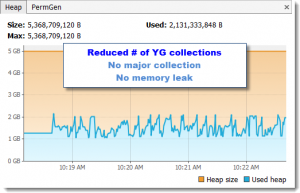
As per JVisualVM, it looks like the JVM is healthy (no memory leak, stable & low OldGen etc.). However, when you deep dive further in the verbose:gc logs, you then realize that the overall JVM pause time is 25.8%, and all due to excessive frequency of YG collections. This is strongly proving the point to properly analyze the verbose:gc logs vs. only focusing on the JVM tenured space trends.
Testing & tuning #1
- 10 concurrent threads
- 50 MB of short lived objects created per execution per JVM process
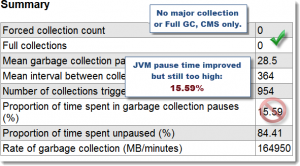
This run simulates an initial improvement of the application footprint and memory allocation rate from 100 MB to 50 MB per allocation. We can clearly see an improvement to all figures, especially the throughput by simply reducing the application memory footprint per request.
Results
- Average response time: 119 ms -21
- Throughput: 79 req / sec +11
- JVM overall pause time: 15.59% -10.21
- YG collection frequency: 3-4 collections per second -3
- Rate of GC: 164 950 MB per minute -143 959
Testing & tuning #2
- 10 concurrent threads
- 5 MB of short lived objects created per execution per JVM process
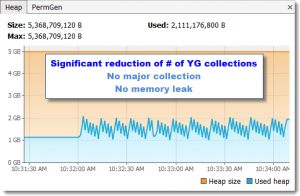
This run simulates a much reduced application footprint and memory allocation rate from 100 MB to only 5 MB per allocation.
Results
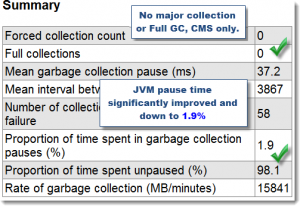
- Average response time: 107 ms -33
- Throughput: 90 req / sec +22
- JVM overall pause time: 1.9% -23.9
- YG collection frequency: 1 collection every 2-3 seconds * significant reduction
- Rate of GC: 15 841 MB per minute -293 068
As you can see, the final improvement to the application footprint and memory allocation did significantly decrease the JVM pause time to a more acceptable 1.9%. It is important to note that throughout these 3 tests, the OldGen footprint and CMS activity did not have any substantial impact on the JVM pause time, the performance problem was due to the excessive activity and high volume of stop the world events associated with the YG collections.
Solutions and recommendations
Our problem case demonstrated that we can reduce the JVM pause time associated with the excessive YG collection activity by tuning and reducing the memory footprint per application request, thus reducing the allocation rate and YG GC frequency.
However, when such tuning strategy is not possible in the short term, it is worth exploring other solutions. Similar results can potentially be achieved through the following capacity improvement strategies:
- Horizontal and vertical scaling: split the traffic via an increased number of JVM processes, at the expense of the available hardware, thus reducing the allocation rate and frequency of YG collections. This essentially means throwing hardware at the problem. My recommendation is always to fine tune your application memory footprint first, and then explore in parallel other scaling options.
- Java heap size & YG ratio tuning: increasing the size of the YG space will definitely help reducing the frequency of stop the world YG collections. Now please be careful that you don’t “starve” the OldGen space otherwise you will simply move the problem with even more severe consequences such as JVM thrashing and OOM events.
Final words
I hope that you enjoyed this article and now have a better understanding of potential performance impact of excessive JVM YG collections.
I recommend that you do the following exercise after reading this article:
- Pick one of your busiest applications.
- Review the verbose:gc log and determine the JVM pause time via GCMV.
- Determine the frequency and impact of the YG collections and identify tuning opportunities.
I’m looking forward for your comments and please share your JVM tuning experience.




This highlights one of the key problems for Java in safety-critical applications – a lack of determinism in the Java VM. I am not sure if that is an easy problem to solve, but I think if someone did tackle it there would be a market for them
Very informative article, especially for those who are into Java, helped me a lot.
Hi Pierre, Thanks a lot for sharing this guide. I have found it very informative. However, I agree with Rand McRanderson on the fact that the key problems in Java cannot be solved quite easily and I’m hoping some solution would be reached at towards solving the same very soon.