Investigating Memory Leaks Part 2 – Analysing the Problem
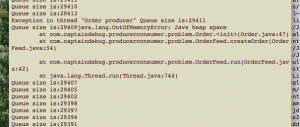
The first blog in this mini-series looked at creating a very leaky sample application, so that we can investigate techniques for solving heap based problems on server applications. It demonstrates the big problem with the Producer-Consumer pattern, namely that the consumer code has to be able to remove items from the queue at least as fast, if not faster than, the producer. The blog ended with me starting the sample code and sitting back whilst it leaked enough memory away to investigate. It’s now time to do that investigation.
If you read part 1 of this blog, you’ll know that the leaky code is part of an application 1 that records stock/share orders in a dummy database using the Producer Consumer pattern. The sample code has been written to contain a very obvious flaw, namely that the OrderRecord can’t keep up with the OrderFeed. This means that the Order queue gets bigger and bigger until finally, the application runs out of heap space and falls over. The thing is, looking at my simple code, the problem should be obvious, but what if you’ve never seen the code before and it’s huge, complex industrial strength code, plus there’s no simple monitoring thread to keep an eye on the queue size or other internals? What do you do then?
Their are three steps required to find the problem with a leaky application:
- Take a dump of the leaky server’s heap.
- Use the heap dump to generate a report.
- Analyse the report.
There are several tools you can use to create a heap dump file. These include:
- jconsole
- jvisualvm
- eclipse Memory Analyser Tool (MAT)
Taking a heap dump with jconsole
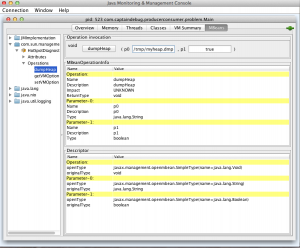
Connect jconsole connected to your application. Click on the MBeans tab and open the com.sun.management package. Then, click on HotSpotDiagnostic. Open Operations and select dumpHeap. You will now see the dumpHeap operation, which takes two parameters p0 and p1. Type a filename for the heap dump into the p0 edit box and press the dumpHeap button.
Taking a heap dump with jvisualvm
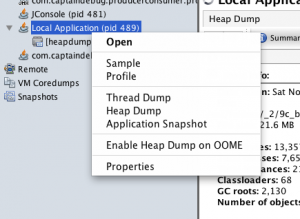
When connected to the sample code, right click on your application in the left hand ‘application’ pane and select ‘Heap Dump’.
Note that if you have a remote connection to your leaky server, then jvisualvm will store the dump file in the remote machine’s /tmp directory (assuming it’s a Unix box). You will have to FTP this file across to your machine for further analysis.
Taking a heap dump with MAT
Whilst jconsole and jvisualvm are part of the JDK, MAT, or memory analyser tool, is an eclipse based tool that you can download from eclipse org
The current version of MAT requires the 1.6 jdk installed on your PC. If you’re using Java 1.7, don’t worry, it’ll install 1.6 for you and it won’t mess up the rest of your machine and the default 1.7 version.
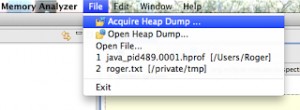
When using MAT, it’s a matter of clicking on ‘Aquire Heap Dump’ and following the instructions.
Remote Connections
The thing to note here is that if you’re trying to figure out why a production server is falling over, then you’ll probably have to connect remotely using JMX and for that you’ll need the following command line options, which I’ve repeated from my previous blog:
-Dcom.sun.management.jmxremote
-Dcom.sun.management.jmxremote.port=9010
-Dcom.sun.management.jmxremote.local.only=false
-Dcom.sun.management.jmxremote.authenticate=false
-Dcom.sun.management.jmxremote.ssl=false
When to Take a Heap Dump
This takes a bit of thought and a bit of luck. If you acquire your heap dump too early then you can’t see the problems because they’re masked by legitimate, non-leaking class instances; however, don’t wait too long because taking a heap dump requires memory and therefore the act of taking a heap dump may cause your app to crash.
The best idea is to attach jconsole to you app and monitor its heap until it looks like it’s on the verge of collapse. This is easy to spot as the three heap section indicators are all green:
Analysing the Heap Dump
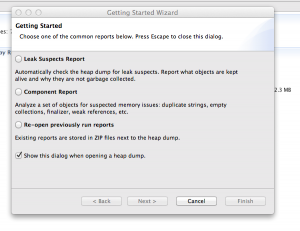
This is where MAT comes in to it’s own as it was designed to analyse heap dumps. To open and analyse a heap dump, select File | Open Heap Dump. After choosing your heap dump file, you will now be given three choices as shown below:
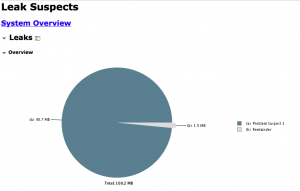
Choose: Leak Suspect Report. MAT will now churn away for a few seconds before producing a page that looks something like this:
The pie chart demonstrates that in this case there is one main leak suspect. You may be thinking that this is a bit of a fix, after all this is sample code, what do you expect? Well, yes, in this case it’s very clear cut; suspect ‘a’ takes up 98.7MB whilst the rest of the objects in memory use the other 1.5MB. The fact this that you do get leak suspect pie charts in real-life situations that look like this.
The next thing to do is to dig a little deeper…
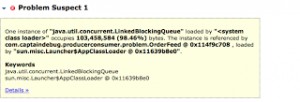
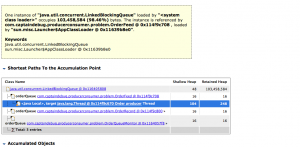
The next part of the report, shown above, tells us that there’s a LinkedBlockingQueue that’s using 98.46% of the memory. To investigate this further, click on Details>>.
This reveals that the problem is indeed our orderQueue, which is accessed by the three objects from my previous blog: OrderFeed, OrderRecord and OrderMonitor and, as we know from the code, contains a whole bunch of Order objects.
So, that’s it; MAT has told us that the sample code has a LinkedBlockingQueue that using up all the sample application’s heap space causing huge problems. It hasn’t told us why this is happening and you can’t really expect it to. That’s a matter of, as Agatha Christie’s Hercule Poirot would say, using “ze little grey cells”…





Hello,
Thanks for your post. I’d like to know what you do if your heap takes 30G-80G? I don’t think it’s possible to use visualvm or mat.
Regards