Java Debugger – The Definitive List of Tools
Java debugging is a complex space. There are many types of debuggers, and numerous tools to choose from. In this page, we’ll cover the differences between 7 types of debuggers, and review the major tools in each category to help you choose the right tool for the right job.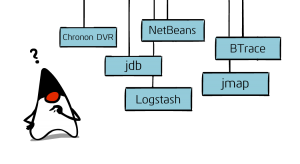
Here are the types of debuggers we cover:
- CLI debuggers
- IDE debuggers
- Build you own debugger
- Heap dumps
- Historical debuggers
- Dynamic tracing
- Production debugging
- Takipi
Definitions
Bugs, to use a broad definition, are instances where the code we wrote and the input we got didn’t match. The different effects of these can be roughly divided into –
- Unexpected flow control, leading to an exception or to a location in the code we don’t want to be at. This is where debuggers are mostly used to examine the correlation of code and state.
- Unexpected heap allocations. In this case we’re either allocating too many objects, or ones too large. Retaining long lasting references to those just adds to the fun. This is where heap analyzers come into play.
- Delayed flow control. This most likely relates to us passing bad input to an external call (i.e. “SELECT * FROM everything”) or getting stuck in a long or infinite loop. This is where performance profilers usually come in.
There’s of course an overlap between the tools and categories, as they all essentially serve the same purpose – getting us to see the state we weren’t expecting so we can fix the code, and make it come to expect it.
1. Command Line Debuggers
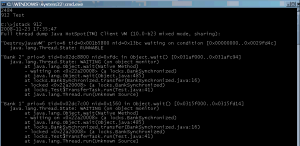
Main tools: The main actor here is jdb, which comes with the JDK and is the JVM equivalent of gdb. It has a command line interface, and can be attached to a running JVM. Like gdb, its functionality is robust and you can pretty much do anything with jdb that you could with a full blown IDE debugger. jdb has a sidekick – jstack – which lets you print the thread call stacks of a live JVM at a given moment. This however does not capture variable or heap state.
Used when: jdb’s biggest upside is its portability. You could get it onto a server fairly quickly without having to attach a debugger remotely. If you’re dealing with a nasty situation on a server and can afford to stall the JVM to inspect it, jdb is your best friend.
Disadvantage: The downside with jdb and jstack is that, as with other command line tools, they’re not very productive for everyday use. That brings us to our next category.
2. IDE Debuggers
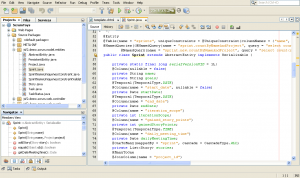
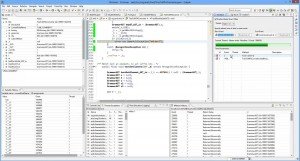
Main tools: In this category two tools lead the pack today – Eclipse and NetBeans. Both use a similar technology as jdb to either attach to or launch a new JVM. While not very portable, you do get all the bells and whistles, which can make debugging shorter and a whole lot more fun.
Used when: Assuming you’re not Dexter (the prodigy, not the serial killer) – everyday.
Disadvantage: As high end desktop applications, they’re not something you’ll want to run on a production machine. There’s always the possibility of remote debugging, but in complex environments, chances of that working out are slim.
3. Build your own debugger
All the debuggers we’ve described so far are built on the same JVM open debugging architecture, most commonly using the JDWP (Java Debugger Wire Protocol) to communicate with a running JVM. JSwat is an example of a standalone debugger built on top of this framework. Want to learn how to build your own Java/Scala debugger? Click here.
Used when: Building a custom JVM extension, or having a very keen interest in how the JVM works.
Disadvantage: This is fairly complex stuff to get right (especially as you don’t want to affect the state of the target JVM), so you need a very compelling reason as to why you can’t use an existing, battle-tested tool.
4. Heap dumps
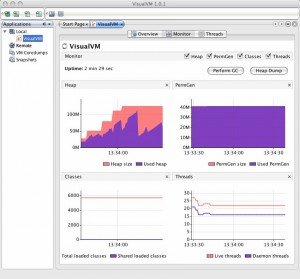
Main tools: jmap, MAT. In many cases, just like Rick Grimes, you’re dealing with the deceased. In these cases you’re looking at a snapshot of a JVM heap, rather than that of a live JVM that’s been stalled. jmap, which comes with the JDK, lets you generate heap dumps from a live JVM. There are a number of tools out there that can then let you explore and analyze the dump. jhat and visualVM, both come with the JDK, do a nice job at that. The Eclipse plug-in MAT and NetBean’s HeapWalker are excellent choices as they harness the already strong IDE UI.
Used when: A complex error occurs and normal debugging techniques can’t be applied (e.g. the app is running on a customer’s server). Another option is to use heap dumps to analyze memory leaks by switching on the JVM -HeapDumpOnOutOfMemoryError flag to have the JVM automatically dump the contents of the heap when it’s depleted.
Disadvantage: The biggest downside of using heap dumps is that they weigh as much as the heap itself (which mostly likely means it’s in the GBs). This then has to be transferred back to you for analysis. Capturing them in production is also no walk in the park.
5. Historical debuggers
Main tools: This category of tools relies on you not being able or not wanting to stall the JVM to collect state or take a heap snapshot. Chronon DVR is a good example of this approach. Here, the debugger uses byte code instrumentation to log data from within the code itself. This usually includes things like the order in which methods were called and the parameters passed on to them. This enables the debugger to then “replay” the code and give you a sense of what the flow control was at the time of execution. Replay Solutions (acquired by CA) is another example with a different approach where IO inputs into the JVM are recorded and then “replayed” back into a live instance – simulating code past execution.
Used when: The primary avenue for this class of tools is usually during QA, where they can help make bugs more reproducible by capturing actual runtime state. Another scenario would be to have a customer or a support engineer run the tool ad-hoc to capture state from the JVM when the application behaves unexpectedly in production.
Disadvantage: The biggest downside of these tools is that logging costs you, and logging everything costs a lot. This means that historical debuggers can slow down an application anywhere from 50% to an order of magnitude, limiting the number of production scenarios where these can be used.
6. Dynamic tracing
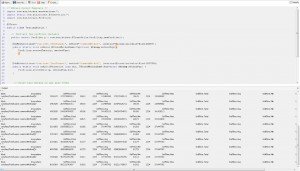
Main tools: BTrace. Tools in this category enable you to selectively print (“trace”) state information from a running JVM without stalling it and without having to record everything that’s happening. Think of it as dynamically weaving in a new piece of code that prints values from within the code itself for you to view. A prominent tool here is BTrace which introduces its own syntax to let you define where and what to trace on your code. The syntax is also designed to support only read-only operations to prevent you from actually altering the state of the program or causing an infinite loop.
Used when: Most often when you’re trying to debug a server for a specific problem (such as a connection pool being depleted) or looking to gather a specific statistic on an ad-hoc basis without stopping the JVM’s execution.
Disadvantage: Just as with debuggers, dynamically tracing from a production server is usually not advisable (and a lot of the time not permissible). There’s also a small learning curve to be able to use dynamic tracing productively in a server environment.
7. Production debugging
Main tools: Logging frameworks (log4j, Logback) to log state and log analyzers (Logstash, Splunk…) to parse the data at scale.
Used when: This is a pretty gritty area, as when you’re dealing with production systems, stalling the JVM to look at the state or take a heap dump is mostly a big no-no. That’s because you’re essentially taking the server down to debug it, something usually done only in extreme cases.
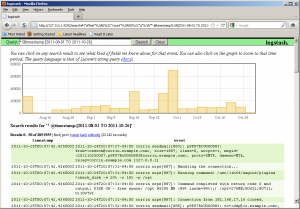
The method by which we usually extract state from the JVM at runtime without stopping it is by selectively logging variable values to file (usually with help of a Java logging framework). We can later use a variety of tools to parse the data, starting from something as simple as tail, all the way to scalable log analyzers such as open source Logstash and enterprise Splunk.
Disadvantage: The biggest downside here is that we of course need to know what to log in advance (and do that efficiently). Logs can also get filled up very quickly, and without a lot of discipline by the dev team, may also contain a lot of unnecessary data or miss some key pieces of data.
Piecing together data from a log file to understand the variable state which led to an error has been observed by scientists to be a very popular developer nightly and holiday pastime.
Debugging with Takipi
We built Takipi with a simple object in mind. We wanted to let developers easily know when and why production code breaks. This means that whenever a new exception or log error begins happening we catch it and notify you. The second part is keeping track of deployments to tell in which one the issue started and how often it’s happening. The last (and most fun) piece is the production debugging part. For each exception or error Takipi shows you the exact source code and variable state (including local and object values) at the moment of error, as if you were there when it happened.




Do you know any tool to get some information (heap dump, stack traces, …) on a customer machine with no JDK installed (only JRE) and complains about his java application frozen ? Some kind of USB SOS toolkit ?
Thanks a lot.
Hi,
You can get Heap dumps using gcore and jmap on a different machine (http://stackoverflow.com/a/9981498/359134) and for stack traces you can have a JRE dump the stack traces to STDOUT with: kill -3 (linux) or http://stackoverflow.com/questions/659650/java-stack-trace-on-windows (windows)