The Logging Olympics – A Race Between Today’s Top 5 Java Logging Frameworks
Developers: Takipi tells you when new code breaks in production – Learn more
Log4J vs SLF4J simple vs Logback vs Java Util Logging vs LOG4J2
Logging is an age-old and intrinsic part of virtually every server-side application. It’s the primary method by which applications output live state in a persistent and readable manner. Some applications may only log a few megabytes a day, while others may log gigabytes of data or more in a matter of hours.
As logging usually involves IO to write data to disk (either blocking or async) – it comes at a cost. When logging large amounts of data over short periods of time, that cost can ramp up quickly. We decided to take a deeper look at the speed of some of today’s leading logging engines.
Most developers log data for three main reasons –
- Monitoring – to see how code behaves in terms of throughput, scale, security, etc..
- Debugging – to get access to the state that caused code to fail (variables, stack traces…). Takipi helps developers debug staging and production servers, and understand why code crashes and threads freeze.
- Analytics – leverage live data from the app in order to derive conclusions about the way it’s being used.
Behind the facade. Most libraries today have logging built-in at key points in the code to provide visibility into their operations. To streamline this process and prevent different libraries from employing multiple logging methods in the same JVM, logging facades, which decouple code from the underlying engine, have come into the forefront. When we analyzed the top 100 software libraries for Java, SLF4J came up as the leading logging facade used by developers today.
The Competition
We decided to pick five of today’s most prominent logging engines, and see how they perform in a number of races. Now, before you take out the torches and pitchforks, I wanted to clarify that the point is not to say which is better, but to give a sense of the differences in throughput between the engines across a number of common logging tasks.
The Contestants
- Log4J
- Log4J2
- Logback
- SLF4J Simple Logging (SLF4J SL)
- Java Util Logging (JUL)
The Race
We wanted to see how the engines compare across a set of standard logging activities. Each logging operation includes a timestamp and a thread ID as its context.
These are the races:
- Logging a string constant
- Logging the .toString() value of a POJO
- Logging a throwable object
- Logging a string constant without time/tid context
The Track
We decided to hold five heats for each race to determine the best score, measuring the number of logging operations completed. In each test we gave the logging engines a task to perform across 10 threads in the space of a minute (the tests ran separately). We then took out the 2 heats with biggest deviation and averaged the results of the remaining three.
Between each individual logging operation we gave the CPU some work to do to put some space between the logging operations (checking whether a small random number is prime). The engines are all running behind SLF4J using their default configuration. The benchmarks were run on an Amazon m1.large EC2 instance.
The Results
To see the full dataset – Click here.
Race #1 – String constants
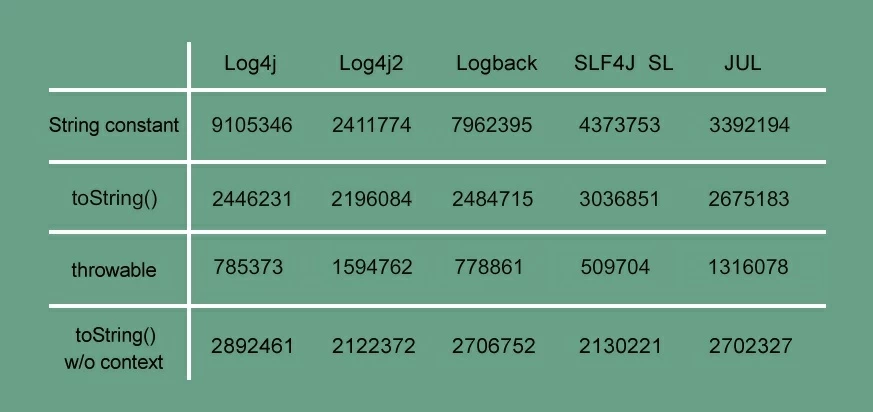
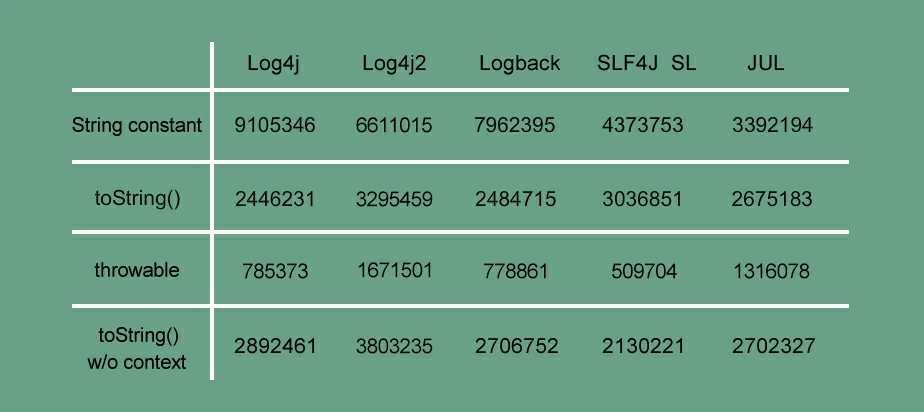
In this race the engines are logging a string constant along with thread and timestamp context. Log4J comes out the clear winner here, being able to write almost 270% more lines than JUL, 12.5% more than logback, 52% more than SLF4J SL. It was intresting to note that before we changed Log4J2′s configuration it was asble to write 4X(!) less lines, with the swtich bossting it up #3 with only 30% less lines written than logback.
Race #2 – .toString()
In this race the engines are logging a POJO (via its .toString) along with thread and timestamp context. The results here were much closer with Log4J2 coming in at #1 with a 25% advantage (post change) over SLF4J SL coming in at #2 with. Log4J and Logback are neck and neck for the #3 spot with JUL taking silver with 88% throughput of SLF4J SL.
Race #3 – Throwable
In this race the engines are logging an exception object and a description string along with thread and timestamp context. It’s in this race the Log4J2 is on fire, coming in at #1 logging more than 3X (!) times the rows when compared SLF4J SL at #5.
Log4J and Logback are also left in the dust, logging less than half the lines of our esteemed winner. JUL comes in at a solid #2, logging 82% of the lines compared to our winner – not too bad.
Race #4 (running barefoot) – .toString() minus context
When dealing with server logs, each entry’s context (e.g. thread ID, class context, time-stamp, etc…) is almost as important as the content of the entry itself. For the previous races we used two of the most common context elements you’ll find in most server log entries – thread ID and timestamp. We thought it’d be interesting to analyze the overhead of those by running a .toString() race without using any of the engines’ context appenders.
Log4J2 is the winner here (post conf change, getting a 180% boost) with a clear 25% lead over by both Logback and JUL. SLF4J SL are trailing behind. It was puzzling to see that across the five different heats, SLF4J SL did better with the appenders than without (would love to hear your thoughts on it in the comments).
Log4J saw the biggest bump with a 15% increase in throughput. JUL, while not performing as well as Log4J or Log4J2 in this race, deliver almost the exact same results with and without the context data.
I’d love to hear your comments and inputs.


What was the change in configuration that improved the log4j2 performance?
Also, the readability of the tables would greatly improve, if you could add thousand separators, i.e. 1,234,567 is much easier to read than 1234567.
Personally I believe that the best option must be integrated with one framework or development tool (Eclipse in this case) and that is it.
The tables would be more readable of the axis were reversed with the tests across the top as columns.
Also indicate if larger is better or worse so when you scan the table you don’t have to read back into the text.
In all cases, your best performance advantage is going to be by using caching file appenders that only write every 100-500 statements. Even 10 saves alot of overhead over raw appenders. Then, install a shutdown hook that flushes the file appenders on shutdown.