Mirror Mirror – Using Reflection To Look Inside The JVM at Run-time
Developers: Takipi tells you when new code breaks in production – Learn more
We’re all used to employing reflection in our everyday work, either directly, or through frameworks that leverage it. Its a main aspect of Java and Scala programming that enables the libraries we use to interact with our code without hard-coded knowledge of it. But our use of reflection is only limited to Java and Scala code that runs inside the JVM. What if we could use reflection to look not only into our code at run-time, but into the JVM’s code as well?
When we began building Takipi, we looked for a way to efficiently analyze JVM heap memory to enable some low-level optimizations, such as scanning the address space of a managed heap block. We came across many interesting tools and capabilities to examine various aspects of the JVM state, and one of them does just that.
It’s one of Java’s strongest and most low-level debugging tools – The Java Serviceability Agent. This powerful tool comes with the HotSpot JDK and enables us to see not only Java objects inside the heap, but look into the internal C++ objects comprising the JVM itself, and that’s where the real magic begins.
Reflection ingredients. When dealing with any form of reflection to dynamically inspect and modify objects at runtime, two essential ingredients are required. The first one is a reference (or address) to the object you want to inspect. The second one is a description of the object’s structure, which includes the offsets in which its fields reside and their type information. If dynamic method invocation is supported, the structure would also contain a reference to the class’s method table (e.g. vtable) along with the parameters each one expects.
Java reflection itself is pretty straightforward. You obtain a reference to a target object just like you would with any other. Its field and method structures are available to you via the universal Object.getClass method (originally loaded from the class’s bytecode). The real question is how do you reflect the JVM itself?
The keys to the castle. Wonderfully enough, the JVM exposes its internal type system through a set of publicly exported symbols. These symbols provide the Serviceability agent (or anyone else for that matter) with access to the structures and addresses of the internal JVM class system. Through these one can inspect almost all aspects of the internal workings of the JVM at the lowest level, including things like raw heap addresses, thread/stack addresses and internal compiler states.
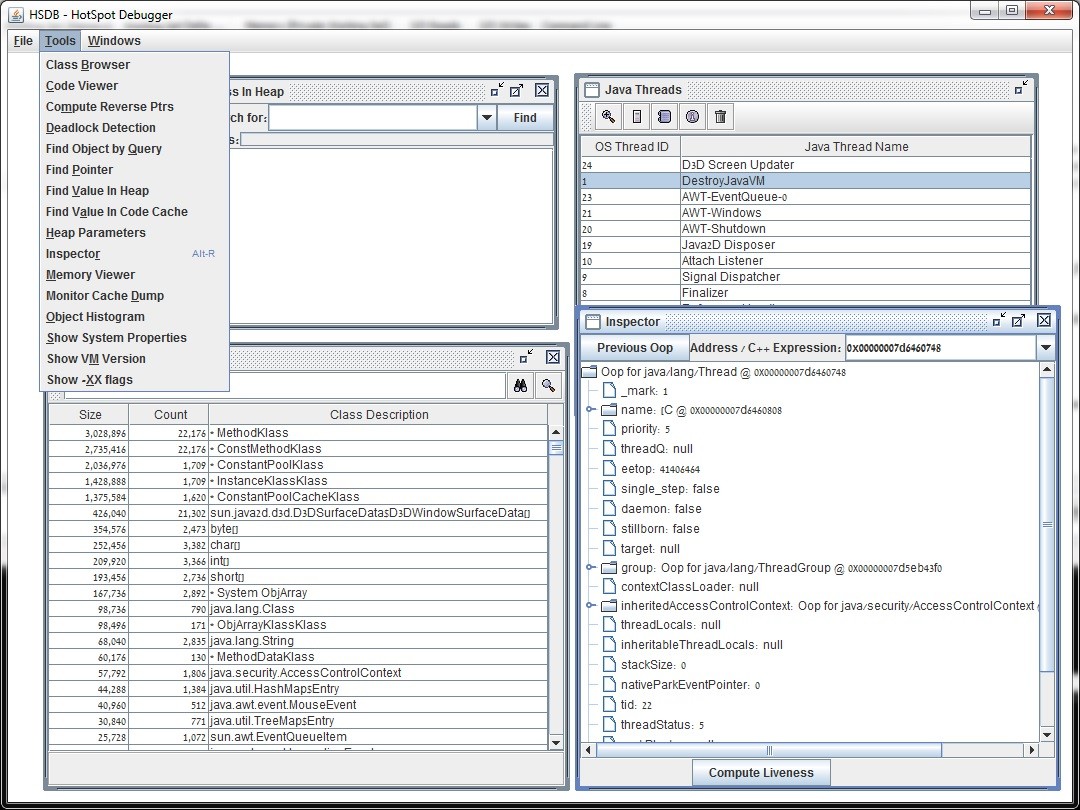
Reflection in action. To get a sense of the possibilities, you can see some of these capabilities in action by launching the Serviceability Agent’s HotSpot Debugger UI. You can do this by launching sa-jdi.jar with sun.jvm.hotspot.HSDB as the main class argument. The capabilities you’ll see are the same ones that help power some of the JVM’s most powerful debugging tools such as jmap, jinfo and jstack.
* HSDB and some of the extremely low-level inspection capabilities it offers into a target JVM.
How it’s done. Let’s take a closer look to understand how these capabilities are actually provided by the JVM. The cornerstone for this approach lies with the gHotSpotVMStructs struct which is publicly exported by the jvm library. This struct exposes both the internal JVM type system as well as the addresses of the root objects from which we can begin reflecting. This symbol can be accessed just like you would dynamically link with any publicly exported OS library symbol via JNI or JNA.
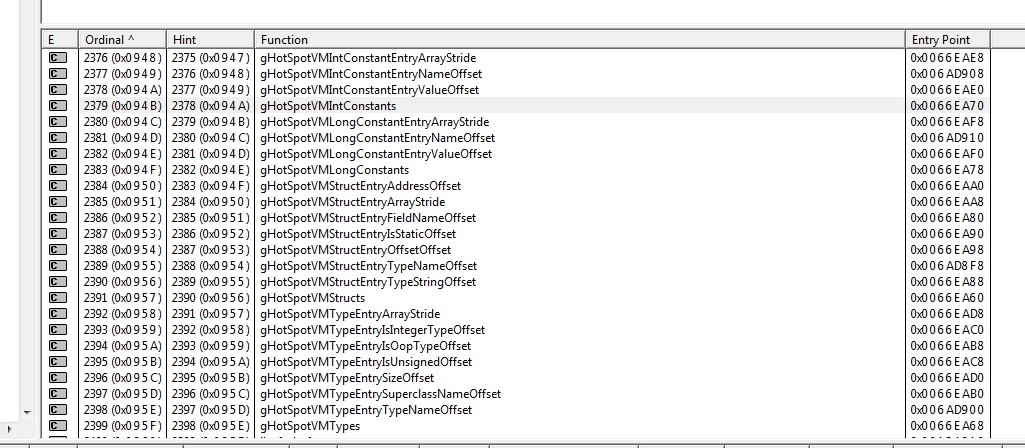
The question then becomes how do you parse the data in the address exposed by the gHotSpotVMStructs symbol? As you can see in the table below, the JVM exposes not only the address of its type system and root addresses, but also additional symbols and values that provide you with the values needed to parse the data. These include the class descriptors and binary offsets in which every field within a class is located.
* A dependency walker screenshot of the symbols exposed by jvm.dll
The manifest. The gHotSpotVMStructs structure points to a list of classes and their fields. Each class provides a list of fields. For each field the structures provide its name, type and whether its a static or non-static field. If it’s a static field the structure would also provide access to its value. In case of a static object type field, the structure would provide the address of the target object. This address serves as a root from which we can begin reflecting a specific component of the internal JVM system. This includes things like compiler, threading or collected heap systems.
You can checkout the actual algorithm used by the Serviceability agent to parse the structure in the Hotspot JDK code here.
Practical examples. Now that we’ve got a broad sense of what these capabilities can do, let’s take a look at some concrete examples of the types of data exposed by this interface. The folks who built the SA agent went through a lot of trouble to create Java wrappers around most of the classes provided by the gHotSpotVMStructs table. These provide a very clean and simple API to access most parts of the internal system in a way that is both type safe and hides most of the binary work required to access and parse the data.
To give you a sense of some of the powerful capabilities exposed by this API, here are some references to the low-level classes it provides –
VM is the singleton class which exposes many of the JVM’s internal systems such as the thread system, memory management and collection capabilities. It serves as an entry point into many of the JVM subsystems and is a good place to start when exploring this API.
JavaThread gives you an inside look at how the JVM sees a Java thread from the inside, with deep information into frames locations and types (compiled, interpreted, native…) as well as actual native stack and CPU register information.
CollectedHeap lets you explore the raw contents of the collected heap. Since HotSpot contains multiple GC implementations, this is an abstract class from which concrete implementations such as ParallelScavengeHeap inherit. Each provides a set of memory regions containing the actual addresses in which Java objects reside.
As you look at the implementation of each class you’ll see it’s essentially just a hard coded wrapper using the reflection-like API to look into the JVM’s memory.
Reflection in C++. Each of these Java wrappers is designed as an almost complete mirror of an internal C++ class within the JVM. As we know C++ doesn’t have a native reflection capability, which raises the question of how that bridge is created.
The answer lies in something very unique which the JVM developers did. Through a series of C++ macros, and a lot of painstaking work, the HotSpot team manually mapped and loaded the field structures of dozens of internal C++ classes into the global gHotSpotVMStructs. This process is what makes them available for reflection from the outside. The actual field offset values and layouts are generated at the JVM compile time, helping to ensure the exported structures are compatible with the JVM’s target OS.
Out-of-process connections. There’s one more powerful aspect to the Serviceability agent that’s worth taking a look at. One of the coolest capabilities the SA framework provides is the ability to reflect an external live JVM from out-of-process. This is done by attaching the Serviceability agent to the target JVM as an OS level debugger. Since this is OS dependent, for Linux the SA agent framework will leverage a gdb debugger connection. For Windows it will use winDbg (which means Windows Debugging Tools will be needed). The debugger framework is extensible, which means one could use another debugger by extending the abstract DebuggerBase class.
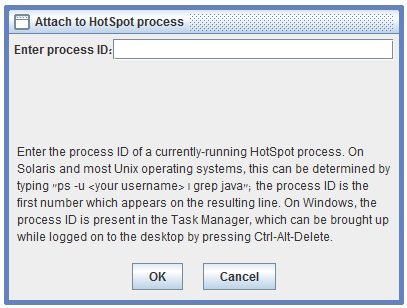
Once a debugger connection is made, the return address value of gHotSpotVMStruct is passed back to the debugger process which can (by virtue of the OS) begin inspecting and even modifying the internal object system of the target JVM. This is exactly how HSDB lets you connect and debug the a target JVM, both the Java and JVM code.
* HSDB’s interface exposes the SA agent’s capability of reflecting a target JVM process
I hope this piqued your interest. From my own personal perspective, this architecture is one of my most favorite pieces of the JVM. Its elegance and openness are in my view definitely things to marvel at. It was also super helpful to us when we were building some of Takipi’s real-time encoding parts, so a big tip of the hat to the good folks who designed it.


