ClassNotFoundException: is it slowing down your JVM?
Most Java developers are familiar with the infamous and very common java.lang.ClassNotFoundException. While the sources of this problem are generally well understood (missing classes/libraries in classpath, class loader delegation problems etc.), the impact to the overall JVM and performance is often unknown. This situation can lead to significant impacts to your application response time and scalability.
Large Java EE enterprise systems with multiple applications deployed are the most exposed to this type of problem due to the large number of different application classloaders active at runtime. This increases the risk of facing “undetected” ClassNotFoundException unless a clear business impact is identified and close log monitoring is implemented, results: on-going performance impact along with possible JVM class loading IO and Thread lock contention.
The following article and sample programs will demonstrate that any occurrence of ClassNotFoundException found from your client production systems should be taken very seriously and addressed promptly.
Java class loading: the missing link for optimal performance
Proper understanding of this performance problem starts with proper knowledge of the Java class loading model. ClassNotFoundException essentially means a failure of the JVM to locate and/or load a particular Java class such as:
- The Class.forName() method
- The ClassLoader.findSystemClass() method
- The ClassLoader.loadClass() method
While class loading of your application Java classes should occur only once in the JVM life-cycle (or through dynamic re-deploy functions), some applications also rely on dynamic class loading operations.
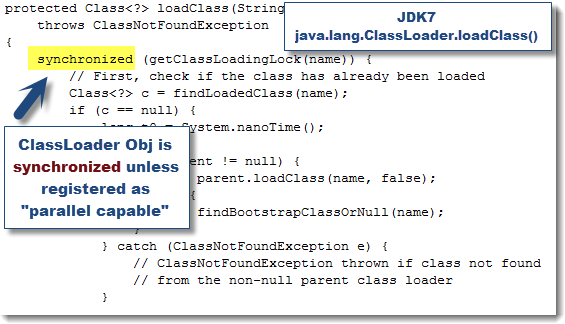
Regardless, repetitive valid and “failing” class loading operations can be quite intrusive, especially when the loading process is attempted by the default JDK java.lang.ClassLoader itself. Indeed, the default JDK 1.7+ behaviour, due to backward compatibility, will allow only one class to be loaded at the time, unless the class loader is tagged as “parallel capable”. Please keep in mind the even if the synchronization is done at the Class level only, a repetitive class loading failure against the same class name is still going to trigger thread lock contention depending of the Java thread concurrency level you are dealing with. The situation was much worst back with JDK 1.6 with synchronization done systematically at the class loader instance level.
For this reason, Java EE containers such as JBoss WildFly 8 are using their own internal concurrent class loaders for the loading of your application classes. These class loaders implements locking at a finer level of granularity, thus allowing loading different classes from the same instance of the class loader concurrently. This is also aligned with the latest JDK 1.7+ improvement introducing the support for Multithreaded Custom Class Loaders which also help prevent certain class loader deadlock scenarios.
That being said, class loading of system level classes such as java.* and Java EE container modules still fall back on the default JDK ClassLoader. This means that repetitive class loading failure for the same class name e.g. ClassNotFoundException can still trigger severe thread lock contention. This is precisely what we will replicate and demonstrate for the rest of the article.
Thread lock contention – problem replication
In order to recreate and simulate this problem, we created a simple application as per below specifications:
- A JAX-RS (REST) Web Service executing Class.forName() against a dummy Class name “located” from the system package level:
String className =”java.lang.WrongClassName”;
Class.forName(className);
- JRE: HotSpot JDK 1.7 @64-bit
- Java EE container: JBoss WildFly 8
- Load testing tool: Apache JMeter
- Java monitoring: JVisualVM
- Java concurrency troubleshooting: JVM Thread Dump analysis
The simulation essentially executes concurrently with 20 threads the JAX-RS Web service. Each invocation generates a ClassNotFoundException. The logging was fully disabled in order to reduce impact on IO and focus on the class loading contention only.
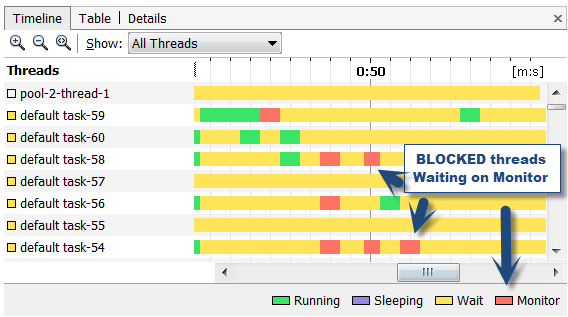
Now let’s look at the results from JVisualVM from our 30-60 seconds run. We can clearly see a lot of BLOCKED threads waiting to acquire a lock on an Object monitor.
Analysis of the JVM thread dump is clearly exposing the problem: Thread lock contention. We can see from the execution stack trace that JBoss delegates the loading of the class to the JDK ClassLoader…why? This is because our wrong Java class name is detected to be part of the system class path e.g. java.*. In this situation, JBoss will delegate the loading to the system class loader, triggering systematic synchronization for that particular class name and waiters from the other threads waiting to acquire a lock to load the same Class name.
Many threads waiting to acquire LOCK 0x00000000ab84c0c8…
 "default task-15" prio=6 tid=0x0000000014849800 nid=0x2050 waiting for monitor entry [0x000000001009d000]
   java.lang.Thread.State: BLOCKED (on object monitor)
            at java.lang.ClassLoader.loadClass(ClassLoader.java:403)
               - waiting to lock <0x00000000ab84c0c8> (a java.lang.Object)
  // Waiting to acquire a LOCK held by Thread “default task-20”
               at sun.misc.Launcher$AppClassLoader.loadClass(Launcher.java:308)
               at java.lang.ClassLoader.loadClass(ClassLoader.java:356)    // JBoss now delegates to system ClassLoader..
               at org.jboss.modules.ConcurrentClassLoader.performLoadClass(ConcurrentClassLoader.java:371)
               at org.jboss.modules.ConcurrentClassLoader.loadClass(ConcurrentClassLoader.java:119)
               at java.lang.Class.forName0(Native Method)
               at java.lang.Class.forName(Class.java:186)
               at org.jboss.tools.examples.rest.MemberResourceRESTService.SystemCLFailure(MemberResourceRESTService.java:176)
               at org.jboss.tools.examples.rest.MemberResourceRESTService$Proxy$_$$_WeldClientProxy.SystemCLFailure(Unknown Source)
               at sun.reflect.GeneratedMethodAccessor15.invoke(Unknown Source)
               at sun.reflect.DelegatingMethodAccessorImpl.invoke(DelegatingMethodAccessorImpl.java:43)
               at java.lang.reflect.Method.invoke(Method.java:601)
……………………..
Culprit thread – default task-20
 "default task-20" prio=6 tid=0x000000000e3a3000 nid=0x21d8 runnable [0x0000000010e7d000]
   java.lang.Thread.State: RUNNABLE
               at java.lang.Throwable.fillInStackTrace(Native Method)
               at java.lang.Throwable.fillInStackTrace(Throwable.java:782)
               - locked <0x00000000a09585c8> (a java.lang.ClassNotFoundException)
               at java.lang.Throwable.<init>(Throwable.java:287)
               at java.lang.Exception.<init>(Exception.java:84)
               at java.lang.ReflectiveOperationException.<init>(ReflectiveOperationException.java:75)
at java.lang.ClassNotFoundException.<init>(ClassNotFoundException.java:82) // ClassNotFoundException!                                      at java.net.URLClassLoader$1.run(URLClassLoader.java:366)
               at java.net.URLClassLoader$1.run(URLClassLoader.java:355)
               at java.security.AccessController.doPrivileged(Native Method)
               at java.net.URLClassLoader.findClass(URLClassLoader.java:354)
               at java.lang.ClassLoader.loadClass(ClassLoader.java:423)
               - locked <0x00000000ab84c0e0> (a java.lang.Object)
               at java.lang.ClassLoader.loadClass(ClassLoader.java:410)
- locked <0x00000000ab84c0c8> (a java.lang.Object)   // java.lang.ClassLoader: LOCK acquired                                                             at sun.misc.Launcher$AppClassLoader.loadClass(Launcher.java:308)
               at java.lang.ClassLoader.loadClass(ClassLoader.java:356)
               at org.jboss.modules.ConcurrentClassLoader.performLoadClass(ConcurrentClassLoader.java:371)
               at org.jboss.modules.ConcurrentClassLoader.loadClass(ConcurrentClassLoader.java:119)
               at java.lang.Class.forName0(Native Method)
               at java.lang.Class.forName(Class.java:186)
               at org.jboss.tools.examples.rest.MemberResourceRESTService.SystemCLFailure(MemberResourceRESTService.java:176)
               at org.jboss.tools.examples.rest.MemberResourceRESTService$Proxy$_$$_WeldClientProxy.SystemCLFailure(Unknown Source)
…………………………………
Now let’s replace our Class name by a Java class tagged as part of the “application” package and re-run the test under the same load conditions.
 String className = "org.ph.WrongClassName";
Class.forName(className);
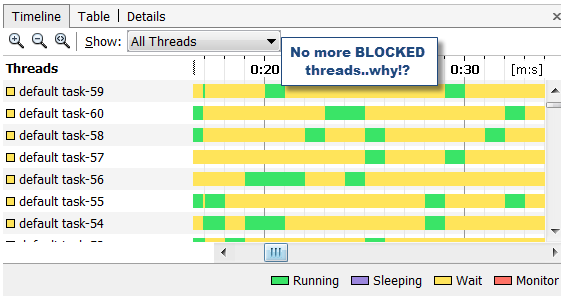
As we can see, we are no longer dealing with BLOCKED threads…why is that? Let’s have a look at the JVM thread dump to better understand this change of behaviour.
 "default task-51" prio=6 tid=0x000000000dd33000 nid=0x200c runnable [0x000000001d76d000]
   java.lang.Thread.State: RUNNABLE
               at java.io.WinNTFileSystem.getBooleanAttributes(Native Method)    // IO overhead due to JAR file search operation
               at java.io.File.exists(File.java:772)
               at org.jboss.vfs.spi.RootFileSystem.exists(RootFileSystem.java:99)
               at org.jboss.vfs.VirtualFile.exists(VirtualFile.java:192)
               at org.jboss.as.server.deployment.module.VFSResourceLoader$2.run(VFSResourceLoader.java:127)
               at org.jboss.as.server.deployment.module.VFSResourceLoader$2.run(VFSResourceLoader.java:124)
               at java.security.AccessController.doPrivileged(Native Method)
               at org.jboss.as.server.deployment.module.VFSResourceLoader.getClassSpec(VFSResourceLoader.java:124)
               at org.jboss.modules.ModuleClassLoader.loadClassLocal(ModuleClassLoader.java:252)
               at org.jboss.modules.ModuleClassLoader$1.loadClassLocal(ModuleClassLoader.java:76)
               at org.jboss.modules.Module.loadModuleClass(Module.java:526)
               at org.jboss.modules.ModuleClassLoader.findClass(ModuleClassLoader.java:189)   // JBoss now fully responsible to load the class
               at org.jboss.modules.ConcurrentClassLoader.performLoadClassUnchecked(ConcurrentClassLoader.java:444) // Unchecked since using JDK 1.7 e.g. tagged as “safe” JDK
               at org.jboss.modules.ConcurrentClassLoader.performLoadClassChecked(ConcurrentClassLoader.java:432)
               at org.jboss.modules.ConcurrentClassLoader.performLoadClass(ConcurrentClassLoader.java:374)
               at org.jboss.modules.ConcurrentClassLoader.loadClass(ConcurrentClassLoader.java:119)
               at java.lang.Class.forName0(Native Method)
               at java.lang.Class.forName(Class.java:186)
               at org.jboss.tools.examples.rest.MemberResourceRESTService.AppCLFailure(MemberResourceRESTService.java:196)
               at org.jboss.tools.examples.rest.MemberResourceRESTService$Proxy$_$$_WeldClientProxy.AppCLFailure(Unknown Source)
               at sun.reflect.GeneratedMethodAccessor60.invoke(Unknown Source)
……………….
The above execution stack trace is quite revealing:
- Since the Java class name was not detected to be part of the Java system package, no ClassLoader delegation was performed, thus no synchronization.
- Since JBoss considers JDK 1.7+ as a “safe” JDK, the ConcurrentClassLoader .performLoadClassUnchecked() method was used, not triggering any Object monitor lock.
- No synchronization means no Thread lock contention triggered as a result of the non-stop ClassNotFoundException error.
It is still important to note that while JBoss is doing a great job at preventing Thread lock contention in this scenario, the repetitive class loading attempt will still degrade the performance to a certain degree due to IO overhead associated with excessive JAR file search operations, again re-enforcing the need to take immediate corrective actions.
Final words
I hope that you enjoyed this article and now have a better understanding of potential performance impacts due to excessive class loading operations. While JDK 1.7 and modern Java EE containers brought great improvements on class loader related issues such as deadlocks and thread lock contention, potential problematic scenarios still remain. For this reason, I highly recommend that you closely monitor your application behaviour, logs and ensure that class loader related errors such as java.lang.ClassNotFoundException and java.lang.NoClassDefFoundError are aggressively corrected.
I’m looking forward for your comments and please share your troubleshooting experience with Java class loaders.


