Temp, Store and Memory Percent Usage in ActiveMQ
In order to effectively use ActiveMQ, it is very important to understand how ActiveMQ manages memory and disk resources to handle non-persistent and persistent messages.
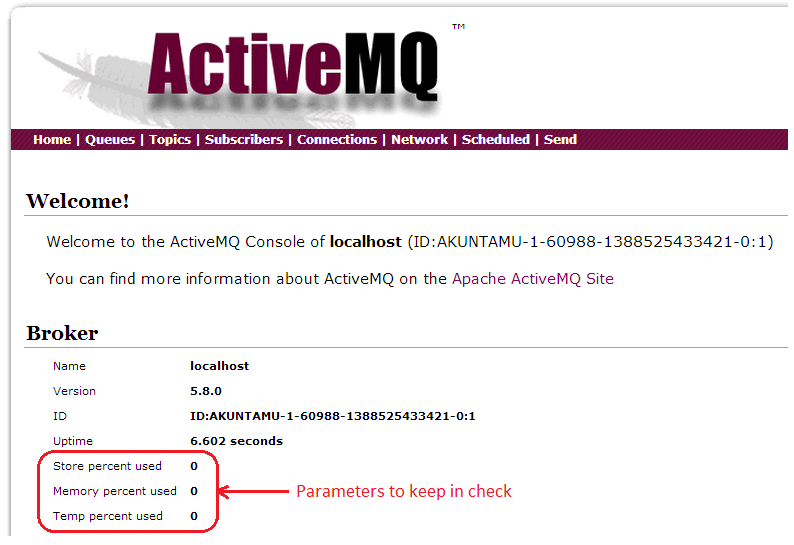
ActiveMQ has three key parameters which need to be kept under check.
- Temp Percent Usage
- This is the % of assigned disk storage that has been used up to spool non-persistent messages
- Non persistent messages are those that don’t survive broker restart
- Store Percent Usage
- This is the % of assigned disk space that has been used up to store persistent messages
- Memory Percent Usage
- This is the % of assigned memory of the broker that has been used up to keep track of destinations, cache messages etc. This value needs to be lesser than -Xmx (Max JVM heap size)
This blog attempts to clarify how store,temp and memory % usage of a single node ActiveMQ broker instance are calculated. We are using ActiveMQ version 5.8.0 for this explanation.
Once we gain clarity on how ActiveMQ operates these values, we can fine tune ActiveMQ using key configuration settings in order to handle the following use cases.
- Large number of destinations (queues/topics)
- The destinations could be created/deleted as needed
- Slow consumers
- This is huge issue when consumers are unable to keep up with the rate at which messages are being produced.
- Message Burst
- Rapid influx of large number of messages with huge payload size for a brief period of time
- Inappropriate Resource utilization
- Few destinations chewing up resources causing others to starve
Scaling Strategies
If you are interested to know how ActiveMQ can be scaled horizontally, please refer to a slide deck created by Bosanac Dejan. You can find it here
It contains different ActiveMQ topologies which can be used effectively to meet volume throughput in addition to various parameters to tune ActiveMQ. I found it extremely useful.
Let’s dig right in…
The following XML snippet is taken from configuration activemq.xml. The values specified for memoryUsage, storeUsage and tempUsage are for discussion purposes only.
 <systemUsage>
            <systemUsage>
                <memoryUsage>
                    <memoryUsage limit="256 mb"/>
                </memoryUsage>
                <storeUsage>
                    <storeUsage limit="512 mb"/>
                </storeUsage>
                <tempUsage>
                    <tempUsage limit="256 mb"/>
                </tempUsage>
            </systemUsage>
</systemUsage>- Memory Usage
- 256MB of JVM memory is available for the broker. Not to be confused with -Xmx parameter.
- Store Usage:
- This is the disk space used by persistent messages (using KahaDB)
- Temp Usage:
- This is the disk space used by non-persistent message, assuming we are using default KahaDB. ActiveMQ spools non-persistent messages to disk in order to prevent broker running out of memory
Understanding Temp Usage
Broker availability is critical for message infrastructure. Hence producer flow control is a protection mechanism that prevents a runaway producer from pumping non-persistent messages into a destination when there are no consumers or when consumer(s) is unable to keep up with the rate at which messages are being produced into the destination.
Let’s take an example of producing non-persistent messages having 1MB payload size into a destination “foo.bar” in a local broker instance
C:\apache-activemq-5.8.0\example>ant producer -Durl=tcp://localhost:61616 -Dtopic=false -Dsubject=foo.bar -Ddurable=false -DmessageSize=1048576
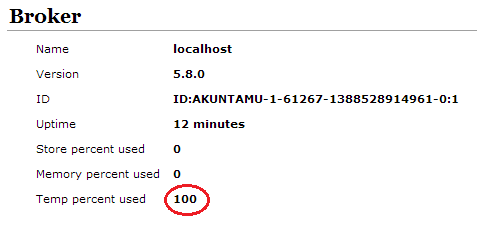
The producer eventually hangs as temp % usage hits 100%
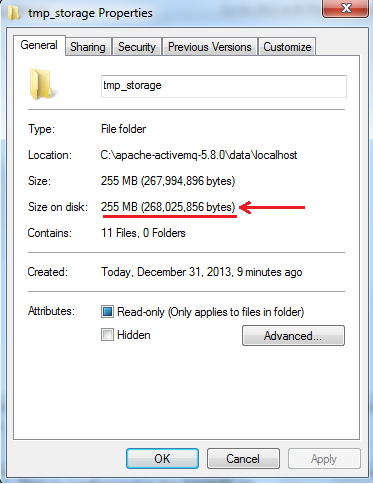
Since the messages are non-persistent, they are going to be stored in tmp_storage on the disk
ActiveMQ provides mechanism to tune memory usage per destination. Here we have a generic policy for all queues where producer flow control is enabled and destination memory limit is 100MB (again this is only for illustration purposes).
<policyEntry queue=">" optimizedDispatch="true" producerFlowControl="true" cursorMemoryHighWaterMark="30" memoryLimit="100 mb" >
The temp % usage is calculated as follows:
(Size of the tmp_storage folder / temp usage memory limit ) * 100
So in our case:
265,025,856/(256*1024*1024) * 100 = 99.8 ~ 100% as shown in the broker console.
The following log message shows up in activemq.log
INFO | Usage(default:temp:queue://foo.bar:temp) percentUsage=99%, usage=268535808, limit=268435456, percentUsageMinDelta=1%;Parent:Usage(default:temp
) percentUsage=100%, usage=268535808, limit=268435456, percentUsageMinDelta=1%: Temp Store is Full (99% of 268435456). Stopping producer (ID:AKUNTAMU-
1-61270-1388528939599-1:1:1:1) to prevent flooding queue://foo.bar. See http://activemq.apache.org/producer-flow-control.html for more info (blocking

for: 1421s)
Let’s take another example…
Consider the following system usage configuration. We have reduced tempUsage to 50MB while keeping the same destination level policy.
 <systemUsage>
            <systemUsage>
                <memoryUsage>
                    <memoryUsage limit="256 mb"/>
                </memoryUsage>
                <storeUsage>
                    <storeUsage limit="512 mb"/>
                </storeUsage>
                <tempUsage>
                    <tempUsage limit="50 mb"/>
                </tempUsage>
            </systemUsage>

        </systemUsage>
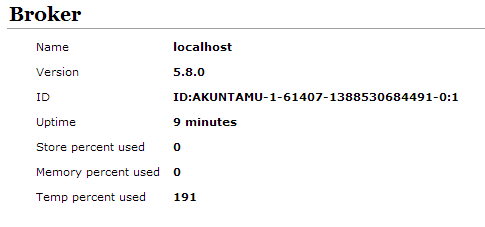
In this case we find that temp usage balloons to 191%
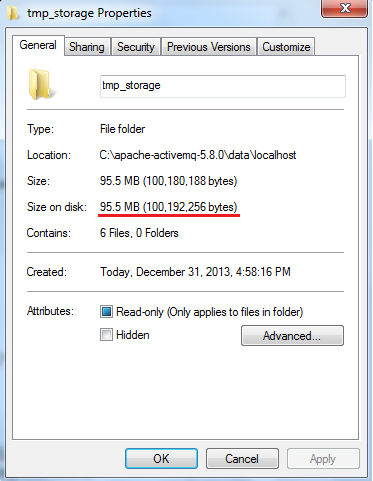
temp_storage stops growing at close to 96MB and producer hangs..
Temp percent usage is 191% because (95.5MB / 50 MB)*100 where 95.5 MB is size of the folder and 50MB is temp usage limit.
The destination has a limit of 100MB so the temp_storage didn’t grow past it. It is sort of confusing which is caused by the fact that temp usage limit is less that per destination memory limit.
Store Usage
Let’s repeat the same test with persistent messages.
The system usage is configured as follows:
 <systemUsage>
            <systemUsage>
                <memoryUsage>
                    <memoryUsage limit="256 mb"/>
                </memoryUsage>
                <storeUsage>
                    <storeUsage limit="512 mb"/>
                </storeUsage>
                <tempUsage>
                    <tempUsage limit="256 mb"/>
                </tempUsage>
            </systemUsage>

          </systemUsage>
Per destination policy is as follows:
<policyEntry queue=">" optimizedDispatch="true" producerFlowControl="true" cursorMemoryHighWaterMark="30" memoryLimit="100 mb" >
Let’s produce 1MB persistent messages into a queue named “foo.bar”
C:\apache-activemq-5.8.0\example>ant producer -Durl=tcp://localhost:61616 -Dtopic=false -Dsubject=foo.bar -Ddurable=true -DmessageSize=1048576
Producer hangs after 512 messages
The following log statement appears in broker log file
 INFO | Usage(default:store:queue://foo.bar:store) percentUsage=99%, usage=537210471, limit=536870912, percentUsageMinDelta=1%;Parent:Usage(default:st
ore) percentUsage=100%, usage=537210471, limit=536870912,percentUsageMinDelta=1%: Persistent store is Full, 100% of 536870912. Stopping producer (ID: AKUNTAMU-1-31754-1388571228628-1:1:1:1) to prevent flooding queue://foo.bar. See http://activemq.apache.org/producer-flow-control.html for more info (
blocking for: 155s)
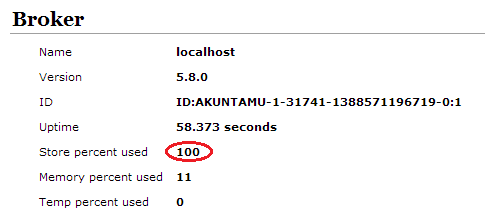
Broker store usage is 100% as shown below.
Since the messages are persistent, they need to be saved onto the file system. Store usage limit is 512MB.
The above screenshot shows the kahadb folder where persistent messages is 543 MB (512MB for the messages and other database related files)
Memory Usage
In the above example, the memory usage percentage is 11. How did that come about?
As per the destination policy, the memory allocated per destination is 100MB and the cursorMemoryHighWaterMark
is specified to be 30. So 30% of 100MB is 30MB. Hence 30MB is used to store messages in memory for faster processing in addition to be being stored in the KahaDB. .
The memory usage limit is configured to be 256MB. So 30MB is ~ 11% of 256
(30/256) * 100 ~ 11%
So if we were to have 9 such queues where similar situation was to occur then we would have exhausted broker memory usage as 11 % * 9 = 99% ~ 100%
Memory usage is the amount of memory used by the broker for storing messages. Many a times, this can become a bottleneck as once this space is full, the broker will stall the producers. There are trade-offs between fast processing and effective memory management.
If we keep more messages in memory, the processing is faster. However the memory consumption will be very high. On the contrary, if messages are kept on the disk then processing will become slow.
Conclusion
We have seen in this blog how store, temp and memory usage work in ActiveMQ. % of store and temp usage cannot be configured per destination while % of memory usage can be because of cursorMemoryHighWaterMark.
Hope you found this information useful. The examples given here are for explanation purposes only and not meant to be production ready. You will need to do proper capacity planning and determine your broker topology for optimal configuration. Feel free to reach out if any comments!
Resources
- http://blog.raulkr.net/2012/08/demystifying-producer-flow-control-and.html
- http://tmielke.blogspot.com/2011/02/observations-on-activemqs-temp-storage.html
- http://activemq.apache.org/javalangoutofmemory.html
- http://www.slideshare.net/dejanb/advanced-messaging-with-apache-activemq -Bosanac Dejan
- http://www.pepperdust.org/?p=150
- http://stackoverflow.com/questions/2361541/how-do-you-scale-your-activemq-vertically
| Reference: | Temp, Store and Memory Percent Usage in ActiveMQ from our JCG partner Ashwini Kuntamukkala at the Ashwini Kuntamukkala – Technology Enthusiast blog. |

