The 7 Log Management Tools Java Developers Should Know
Splunk vs. Sumo Logic vs. LogStash vs. GrayLog vs. Loggly vs. PaperTrails vs. Splunk>Storm
Splunk, Sumo Logic, LogStash, GrayLog, Loggly, PaperTrails – did I miss someone? I’m pretty sure I did. Logs are like fossil fuels – we’ve been wanting to get rid of them for the past 20 years, but we’re not quite there yet. Well, if that’s the case I want a BMW!
To deal with the growth of log data a host of log management & analysis tools have been built over the last few years to help developers and operations make sense of the growing data. I thought it’d be interesting to look at our options and what are each tools’ selling point, from a developer’s standpoint.
Splunk
As the biggest tool in this space, I decided to put Splunk in a category of its own. That’s not to say it’s the best tool for what you need, but more to give credit to a product who essentially created a new category.
Pros
Splunk is probably the most feature rich solution in the space. It’s got hundreds of apps (I counted 537) to make sense of almost every format of log data, from security to business analytics to infrastructure monitoring. Splunk’s search and charting tools are feature rich to the point that there’s probably no set of data you can’t get to through its UI or APIs.
Cons
Splunk has two major cons. The first, that is more subjective, is that it’s an on-premise solution which means that setup costs in terms of money and complexity are high. To deploy in a high-scale environment you will need to install and configure a dedicated cluster. As a developer, it’s usually something you can’t or don’t want to do as your first choice.
Splunk’s second con is that it’s expensive. To support a real-world application you’re looking at tens of thousands of dollars, which most likely means you’ll need sign offs from high-ups in your organization, and the process is going to be slow. If you’ve got a new app and you want something fast that you can quickly spin up and ramp as things progress – keep reading.
Some more enterprise log analyzers can be found here.
SaaS Log Analyzers
Sumo Logic
Sumo was founded as a SaaS version of Splunk, going so far as to imitate some of splunk’s features and visuals early on. Having said that, SL has developed to a full fledged enterprise class log management solution.
Pros
SL is chock-full of features to reduce, search and chart mass amounts of data. Out of all the SaaS log analyzers, it’s probably the most feature rich. Also, being a SaaS offering it inherently means setup and ongoing operation are easier. One of Sumo Logic’s main points of attraction is the ability to establish baselines and to actively notify you when key metrics change after an event such as a new version rollout or a breach attempt.
Cons
This one is shared across all SaaS log analyzers, which is you need to get the data to the service to actually do something with it. This means that you’ll be looking at possible GBs (or more) uploaded from your servers. This can create issues on multiple fronts –
- As a developer, if you’re logging sensitive or PII you need to make sure it’s redacted.
- There may be a lag between the time data is logged and the time it’s visible to to the service.
- There’s additional overhead on your machines transmitting GBs of data, which really depends on your logging throughput.
Sumo’s pricing is also not transparent, which means you might be looking at a buying process which is more complex than swiping your team’s credit card to get going.
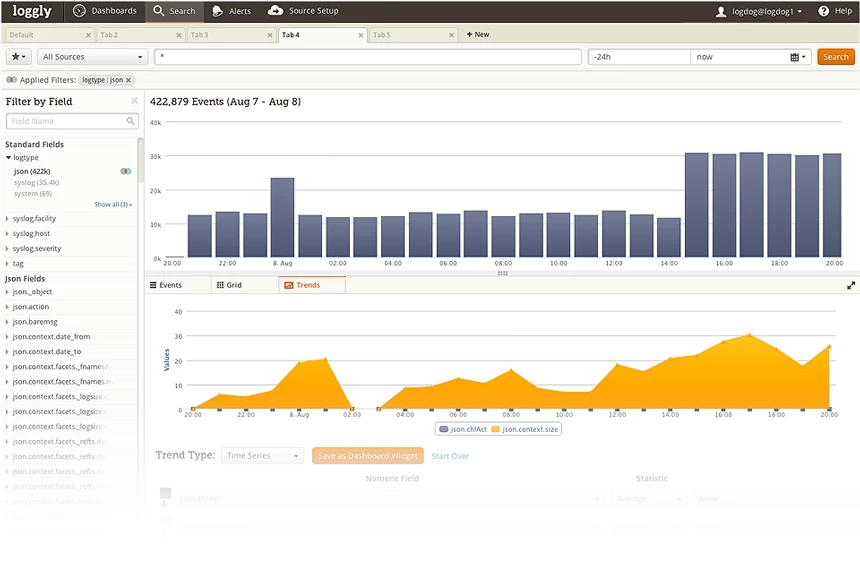
Loggly
Loggly is also a robust log analyzer, focusing on simplicity and ease of use for a devops audience.
Pros
Whereas Sumo Logic has a strong enterprise and security focus, Loggly is geared more towards helping devops find and fix operational problems. This makes it very developer-friendly. Things like creating custom performance and devops dashboards are super-easy to do. Pricing is also transparent, which makes start of use easier.
Cons
Don’t expect Loggly to scale into a full blown infrastructure, security or analytics solution. If you need forensics or infrastructure monitoring you’re in the wrong place. This is a tools mainly for devops to parse data coming from your app servers. Anything beyond that you’ll have to build yourself.
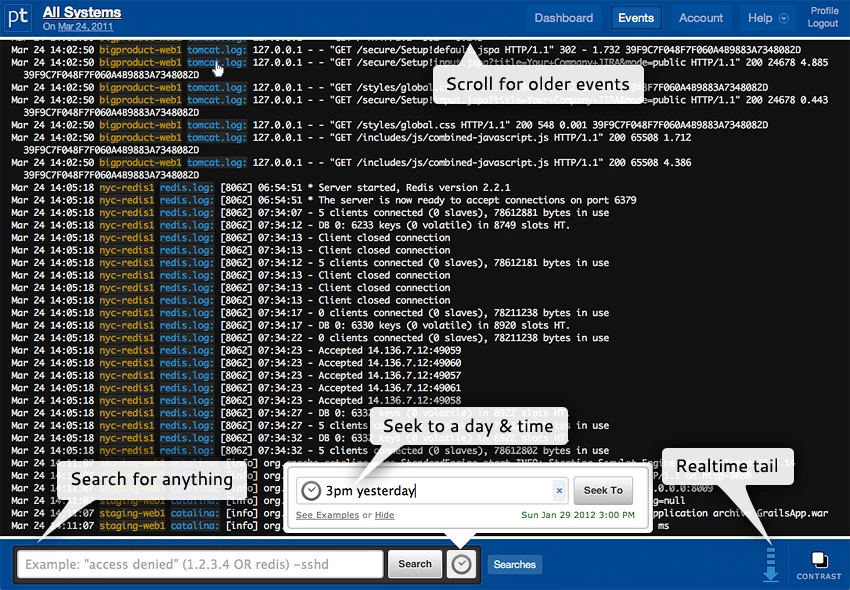
PaperTrails
PaperTrails is a simple way to look and search through logs from multiple machines, in one consolidated easy-to-use interface. Think of it like tailing your log in the cloud, and you won’t be too far off.
Pros
PT is what it is. A simple way to look at log files from multiple machines in a singular view in the cloud. The UX itself is very similar to looking at a log on your machine, and so are the search commands. It aims to do something simple and useful, and does it elegantly. It’s also very affordable.
Cons
PT is mostly text based. Looking for any advanced integrations, predictive or reporting capabilities? You’re barking up the wrong tree.
Splunk>Storm
This is Splunk’s little (some may say step) SaaS brother. It’s a pretty similar offering that’s hosted on Splunk’s servers.
Pros
Storm lets you experiment with Splunk without having to install the actual software on-premise, and contains much of the features available in the full version.
Cons
This isn’t really a commercial offering, and you’re limited in the amount of data you can send. It seems to be more of an online limited version of Splunk meant to help people test out the product without having to deploy first. A new service called Splunk Cloud is aimed at providing a full-blown Splunk SaaS experience.
Open Source Analyzers
Logstash
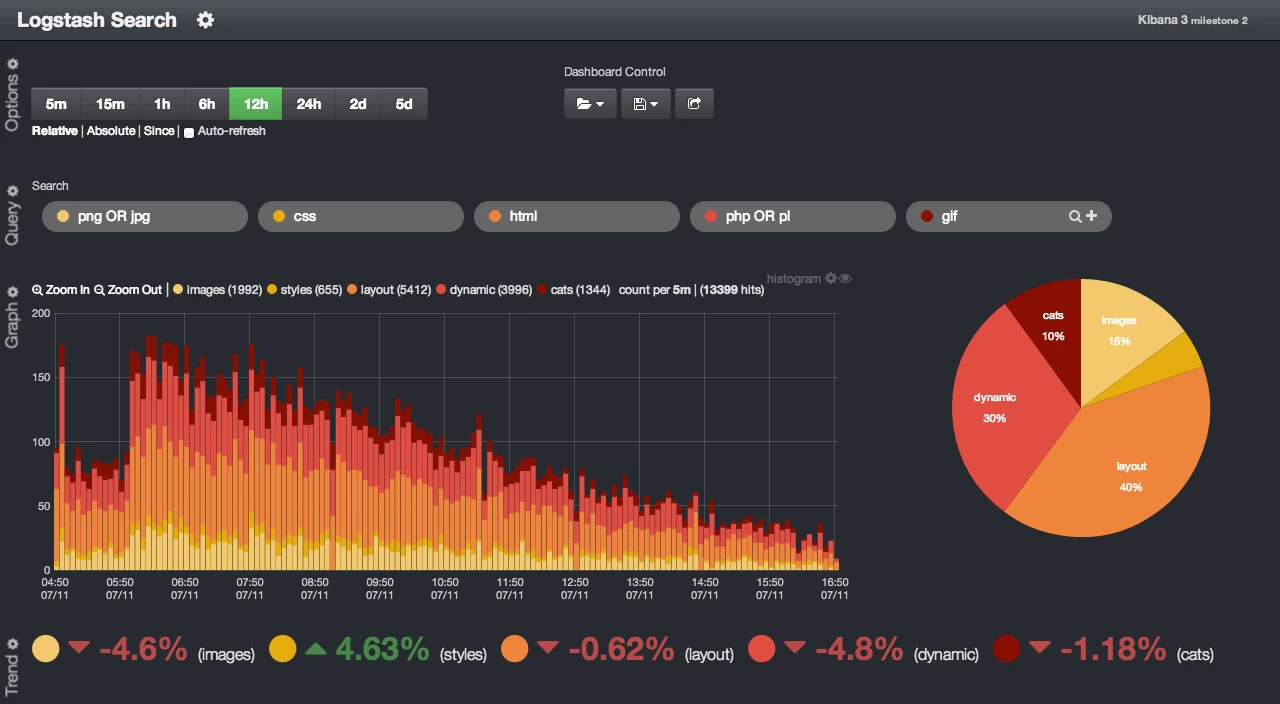
Logstash is an open source tool for collecting and managing log files. It’s part of an open-source stack which includes ElasticSearch for indexing and searching through data and Kibana for charting and visualizing data. Together they form a powerful Log management solution.
Pros
Being an open-source solution means you’re inherently getting a lot of a control and a very good price. Logstash uses three mature and powerful components, all heavily maintained, to create a very robust and extensible package. For an open-source solution it’s also very easy to install and start using. We use Logstash and love it.
Cons
As Logstash is essentially a stack, it means you’re dealing with three different products. That means that extensibility also becomes complex. Logstash filters are written in Ruby, Kibana is pure javascript and ElasticSearch has its own REST API as well as JSON templates.
When you move to production, you’ll also need to separate the three into different machines, which adds to the complexity.
Graylog2
A fairly new player in the space, GL2 is an open-source log analyzer backed by MongoDB as well as ElasticSearch (similar to Logstash) for storing and searching through log errors. It’s mainly focused on helping developers detect and fix errors in their apps.
Also in this category you can find fluentd and Kafka whose one of its main use-cases is also storing log data. Phew, so many choices!
Takipi for Logs
While this post is not about Takipi, I thought there’s one feature it has which you might find relevant to all of this.
The biggest disadvantage in all log analyzers and log files in general, is that the right data has to be put there by you first. From a dev perspective, it means that if an exception isn’t logged, or the variable data you need to understand why it happened isn’t there, no log file or analyzer in the world can help you. Production debugging sucks!
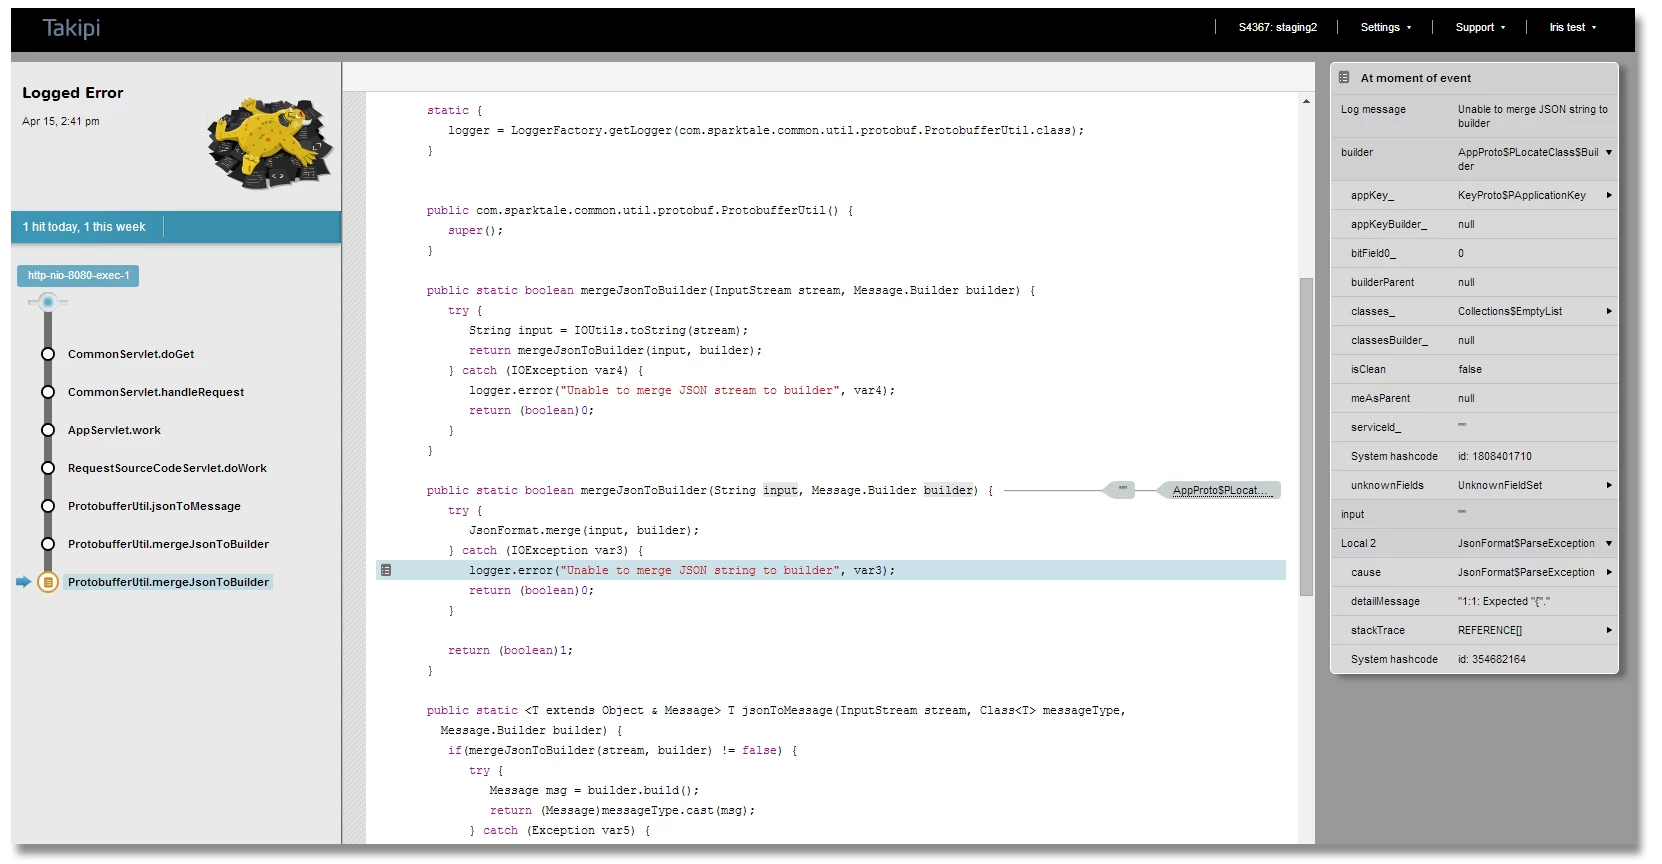
One of the things we’ve added to Takipi is the ability to jump into a recorded debugging session straight from a log file error. This means that for every log error you can see the actual source code and variable values at the moment of error. You can learn more about it here.
This is one post where I would love to hear from you guys about your experiences with some of the tools mentioned (and some that I didn’t). I’m sure there are things you would disagree with or would like to correct me on – so go ahead, the comment section is below and I would love to hear from you.
| Reference: | The 7 Log Management Tools Java Developers Should Know from our JCG partner Tal Weiss at the Takipi blog. |


Tal – I work at Sumo Logic and wanted to thank you for publishing this article. Just a few clarifications on the article about us. * We actually do provide the ability to enter a credit card and upgrade from our free product to a paid version -that pricing is made available in the user interface of the free product. * Our collectors actually compress data 10x before logs gets sent to us so we certainly understand the issues you bring up re: bandwidth * We give you the ability to hash, mask and filter data at the collector level… Read more »
Hey Sanjay, thanks for the clarification re pricing. Much appreciated!
Re PII, it’s still something I assume a developer would have to manually make sure (either at the code or at your collector’s) isn’t transferred out. This requires going through the log operations one by one, with continuous maintenance of that discipline. It’s an effort that needs to be put in for any SaaS logger not just Sumo, by a company with sensitive PII.
You’re absolutely right – you could write rules in Sumo Logic at the collector level so you don’t have to go through each and every message but it still involves a conscious step by the developers.
You left out LogZilla :-)
http://www.logzilla.net
LogZilla v4 can scale to over 1 billion events per day and still only takes seconds to search.
Hey Clayton,
Thanks for the comment. It’s true, there a lot of good tools out there, more than I could get into this post, so thanks for adding LogZilla to the list as well.
Hi Tal, Interesting comparisons. One thing though: it’s kind of misleading to compare (open source) log collectors like Fluentd and Logstash with proprietary log search backends like Splunk, Papertrails and Sumo Logic. Fluentd/Logstash themselves do not have the ability to store/index log data but they sit between data sources (syslog, log file, etc.) and ship data to backend systems (For Logstash, Elasticsearch seems to be the canonical destination whereas it’s an even split among HDFS/S3/MongoDB/Elasticsearch for Fluentd). A more apt comparison would be between Fluentd/Logstash and Splunk Universal Forwarder. Also, your description of Kafka seemed a bit misleading. Kafka is… Read more »
Hey Kiyoto, Thanks for the great comment and insights. Good stuff! The point of the post is not to compare tools (especially between diff types such as SaaS, on-prem and OS), but more to highlight some of the main tools in the space every dev should know about , and what are the key advantages of each. Discussing Logstash, I tried to highlight that it is one part of an OS stack (which includes Kibana, and ES) used to create a complete log analytics solution. Re Kafka, one of its main use-cases (http://kafka.apache.org/documentation.html#uses) is log aggregation, so I thought I’d… Read more »
You also left out NXLog :)
https://nxlog.co/products/nxlog-community-edition
It’s free, open source and highly-scalable, also multi-platform so it can collect and process logs from Linux, Windows, Android and more operating systems.