Hibernate Statistics with Hawtio and Jolokia
A huge part of enterprise Java deals with data. Among all the different ways of working with data in enterprise settings, there is still the proven and widely taught approach to use O/R mapping of any kind. The JPA standard makes this comparably easy to use for everybody and it should also be portable. But let’s not talk about migration details. The biggest drawback of O/R mapping is, that a developer tend to lose contact with what’s happening on the database or even to which exact SQL statements get issued against it. This is the number one reason that those projects run into performance issues. If you’re there, you need to analyze the root causes and drill down to the problems. I recently found a nice feature of Hibernate which makes this comparably easy.
Available Statistics And Ways To Get Them.
Hibernate up to 3.5.x ships with a statistics and metrics API that allows you to figure out a lot about what is happening under the covers. All available counters are described in the Statistics interface API, in three categories:
- Metrics related to the general Session usage, such as number of open sessions, retrieved JDBC connections, etc.
- Metrics related to the entities, collections, queries, and caches as a whole (aka global metrics).
- Detailed metrics related to a particular entity, collection, query or cache region.
For example, you can check the cache hit, miss, and put ratio of entities, collections and queries, and the average time a query needs. Be aware that the number of milliseconds is subject to approximation in Java. Hibernate is tied to the JVM precision and on some platforms this might only be accurate to 10 seconds.
Simple getters are used to access the global metrics (i.e. not tied to a particular entity, collection, cache region, etc.). You can access the metrics of a particular entity, collection or cache region through its name, and through its HQL or SQL representation for queries. Please refer to the Statistics, EntityStatistics, CollectionStatistics, SecondLevelCacheStatistics, and QueryStatistics API Javadoc for more information.
All you have to do is enable statistics for the session factory you’re interested in and retrieve the statistics to analyze them. There are plenty of examples out there how to use this feature with Spring. The reason is pretty simple: Spring comes with a legendary MBeanExporter which exposes JMX MBeans as Java Objects. And guess what: Hibernate Statistics provides an easy way of exposing them through JMX. But there is no need to use Spring if you just put together some more RedHat magic!
You basically have two different ways of enabling the statistics in your configured setting. The easiest way is to add a property to your persistence-unit configuration:
<property name="hibernate.generate_statistics" value="true"/>
But it is also possible to enable them manually. More details on how to do that can be found on the community wiki and in the performance-monitoring section in the Hibernate documentation.
Enabling and Exposing Statistics By Example
I created a little example standalone Hibernate application with two entities and a main class which is working with hibernate and initializing everything you need to know. Get your hands on it instantly by forking it on GitHub. Here is the little walk-through:
There are the two mandatory entities (Department and Employee) and the META-INF/persistence.xml. This is the basic setting. There is not much magic in here. You can see where to enable the statistics (potentially) in the persistence.xml. The example enables them in the main class JpaTest. But let’s start at the beginning. The main method performs the following steps in order:
- Create the EntityManager to use.
- Register the Statistics Mbean we need.
- Initialize the Jolokia Server to expose JMX via JSON for Hawtio
- Does something with the entities.
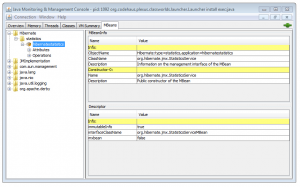
The magic starts in step two which is in the registerHibernateMBeans(EntityManager manager) method. It get’s hand on the PlatformMBeanServer, registers the relevant Hibernate JMX Mbean, set’s the Session Factory in which we’re interested in to it and enables the statistics. That is easy. Now you have a JMX MBean “Hibernate” with the attribute “statistics” registered. If you have access to the server via JConsole or Mission Control or VisualVM you can simply connect to the process and browse through the statistics:
In production environments this typically isn’t possible at all. So you would need to find a way to access this via http/https. This is where I found it handy to try out Hawtio as a a modular web console for managing your Java stuff. Burned down to the basics it is a web-console with plugins. It has a ton of plugins and can be customized and extended to fit your needs. Today we’re looking at a very simple plugin, the JMX plugin. It gives you a raw view of the underlying JMX metric data, allowing access to the entire JMX domain tree of MBeans. But in order to make this happen, we first need to find a way to expose the JMX features to Hawtio. This is where Jolokia comes in. There is a JVM agent in it who can expose JMX MBeans via JSON. All you have to do is to init and start the server like this:
JolokiaServerConfig config = new JolokiaServerConfig(new HashMap<String, String>());
JolokiaServer jolokiaServer = new JolokiaServer(config, true);
jolokiaServer.start();
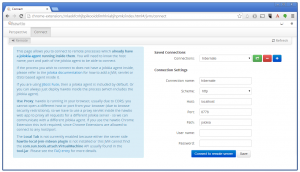
Now you’re ready to try out the Hawtio console. Have a look at the quickstart to see what is possible. For this example I just use the Google Chrome Extension which you just have to download and drag into your extensions page in Chrome. This looks like:
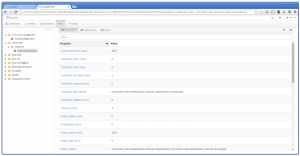
If you configure “localhost”, “8778” and path “jolokia” you’re all set to start browsing your results. After you click “connect” you can look through the dashboard or switch to the JMX view and navigate to the Hibernate MBean:

There is a more comprehensive introduction to Hawtio by Stan Lewis from DevNation 2014 waiting for you to watch it:
That was the short example. Go ahead and look at the GitHub source-code and feel free to look into Hawtio a bit more:
- Read the getting started guide to find out how to download and install Hawtio in your own environment.
- Read up on how to configure Hawtio in various environments, such as configuring security and where Hawtio stores stuff.
- See how to configure Hawtio on WildFly.
- We prefer to use the issue tracker for dealing with ideas and issues, but if you just want to chat about all things Hawtio please join us on the mailing list.
- Find the Hawtio source-code on GitHub.
| Reference: | Hibernate Statistics with Hawtio and Jolokia from our JCG partner Markus Eisele at the Enterprise Software Development with Java blog. |


