Storing months of historical metrics from Hystrix in Graphite
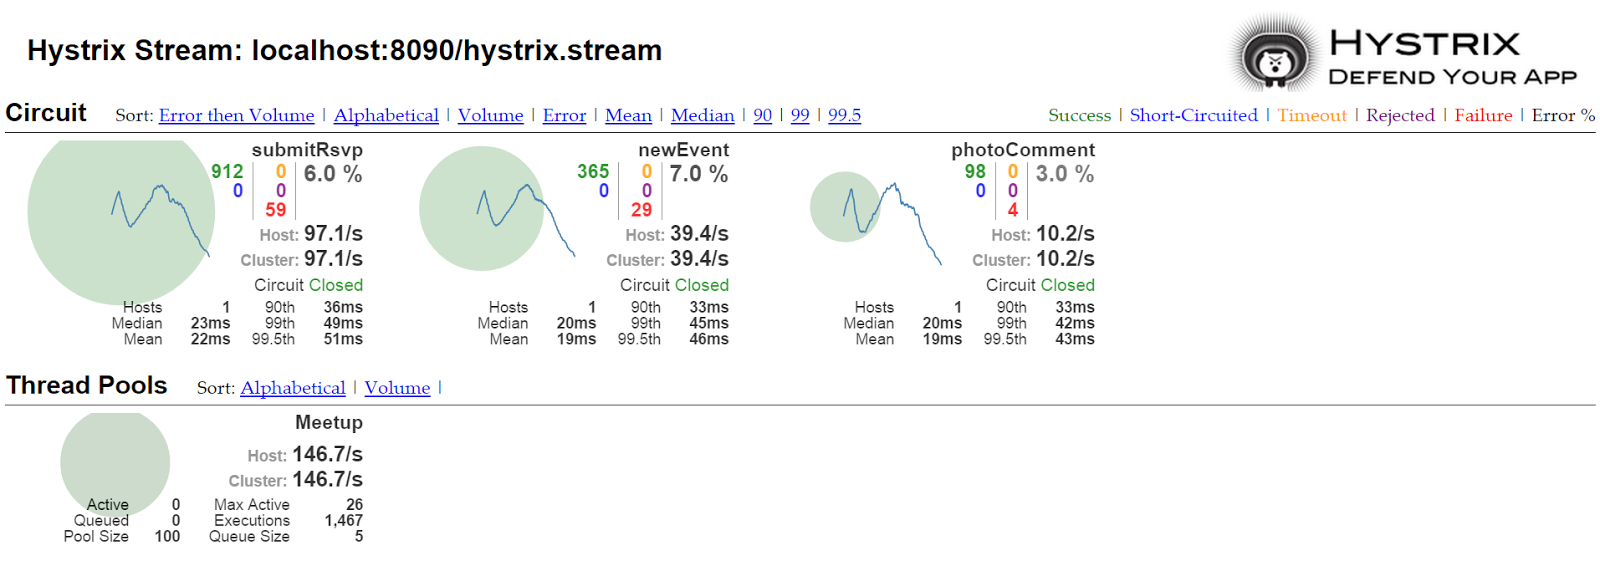
One of the killer-features of Hystrix is a low-latency, data-intensive and beautiful dashboard:

Even though it’s just a side-effect of what Hystrix is really doing (circuit breakers, thread pools, timeouts, etc.), it tends to be the most impressive feature. In order to make it work you have to include hystrix-metrics-event-stream dependency:
<dependency>
    <groupId>com.netflix.hystrix</groupId>
    <artifactId>hystrix-metrics-event-stream</artifactId>
    <version>1.4.0-RC6</version>
</dependency>
and register built-in servlet, e.g. in embedded Jetty:
import org.eclipse.jetty.server.Server;
import org.eclipse.jetty.servlet.ServletContextHandler;
import org.eclipse.jetty.servlet.ServletHolder;

//...

Server server = new Server(8090);
ServletContextHandler context = new ServletContextHandler(ServletContextHandler.NO_SESSIONS);
server.setHandler(context);
final HystrixMetricsStreamServlet servlet = new HystrixMetricsStreamServlet();
final ServletHolder holder = new ServletHolder(servlet);
context.addServlet(holder, "/hystrix.stream");
server.start();
Of course if you already have a web application, it’s much simpler. Here is an example in Spring Boot:
@Bean
public ServletRegistrationBean servletRegistrationBean() {
    return new ServletRegistrationBean(new HystrixMetricsStreamServlet(), "/hystrix.stream");
}
From now on your application will stream real-time metrics in JSON format, which can easily be consumed using open-source dashboard, almost entirely written in JavaScript:
$ git clone git@github.com:Netflix/Hystrix.git
$ cd Hystrix
$ ./gradlew :hystrix-dashboard:jettyRun
After few seconds you can browse to localhost:7979 and point to your /hystrix.stream servlet. Assuming your application is clustered, most likely you will add Turbine to the party.
If you are using Hystrix, you know about all of this already. But one of the questions I am asked most often is: why these metrics are so short-term? Indeed, if you look at the dashboard above, metrics are aggregated with sliding window ranging from 10 seconds to 1 minute. If you received and automatic e-mail notification about some occurrence on production, experienced brief slowness or heard about performance problems from a customer, relevant statistics about this incident might already be lost – or they might be obscured by general instability that happened afterwards.
This is actually by design – you can’t have both low-latency, near real time statistics, that are as well durable and can be browsed days if not months back. But you don’t need two monitoring systems for short-term metrics and long-term trends. Instead you can feed Graphite directly with Hystrix metrics. With almost no code at all, just a little bit of glue here and there.
Publishing metrics to Dropwizard metrics
It turns out all building blocks are available and ready, you just have to connect them. Hystrix metrics are not limited to publishing servlet, you can as well plug in other consumers, e.g. Dropwizard metrics:
<dependency>
    <groupId>com.netflix.hystrix</groupId>
    <artifactId>hystrix-codahale-metrics-publisher</artifactId>
    <version>1.4.0-RC6</version>
    <exclusions>
        <exclusion>
            <groupId>com.codahale.metrics</groupId>
            <artifactId>metrics-core</artifactId>
        </exclusion>
    </exclusions>
</dependency>
<dependency>
    <groupId>io.dropwizard.metrics</groupId>
    <artifactId>metrics-core</artifactId>
    <version>3.1.0</version>
</dependency>
You have to connect these two libraries explicitly, I’m using Spring Boot for orchestration, notice that MetricRegistry is automatically created by Boot:
@Bean
HystrixMetricsPublisher hystrixMetricsPublisher(MetricRegistry metricRegistry) {
    HystrixCodaHaleMetricsPublisher publisher = new HystrixCodaHaleMetricsPublisher(metricRegistry);
    HystrixPlugins.getInstance().registerMetricsPublisher(publisher);
    return publisher;
}
The moment Hystrix publishes to Dropwizard metrics, we can redirect these metrics to SLF4J, JMX or… Graphite!
Graphite and Grafana
We need one more dependency:
<dependency>
    <groupId>io.dropwizard.metrics</groupId>
    <artifactId>metrics-graphite</artifactId>
    <version>3.1.0</version>
</dependency>
This allows metrics library to publish data straight to Graphite, just a little bit of glue again:
@Bean
public GraphiteReporter graphiteReporter(MetricRegistry metricRegistry) {
    final GraphiteReporter reporter = GraphiteReporter
            .forRegistry(metricRegistry)
            .build(graphite());
    reporter.start(1, TimeUnit.SECONDS);
    return reporter;
}

@Bean
GraphiteSender graphite() {
    return new Graphite(new InetSocketAddress("localhost", 2003));
}
Obviously you would like to tweak Graphite address. Setting up Graphite and Grafana is quite cumbersome, luckily there is a Docker image for that:
$ docker run -d \
    -p 8070:80 -p 2003:2003 -p 8125:8125/udp -p 8126:8126 \
    --name grafana-dashboard \
    choopooly/grafana_graphite
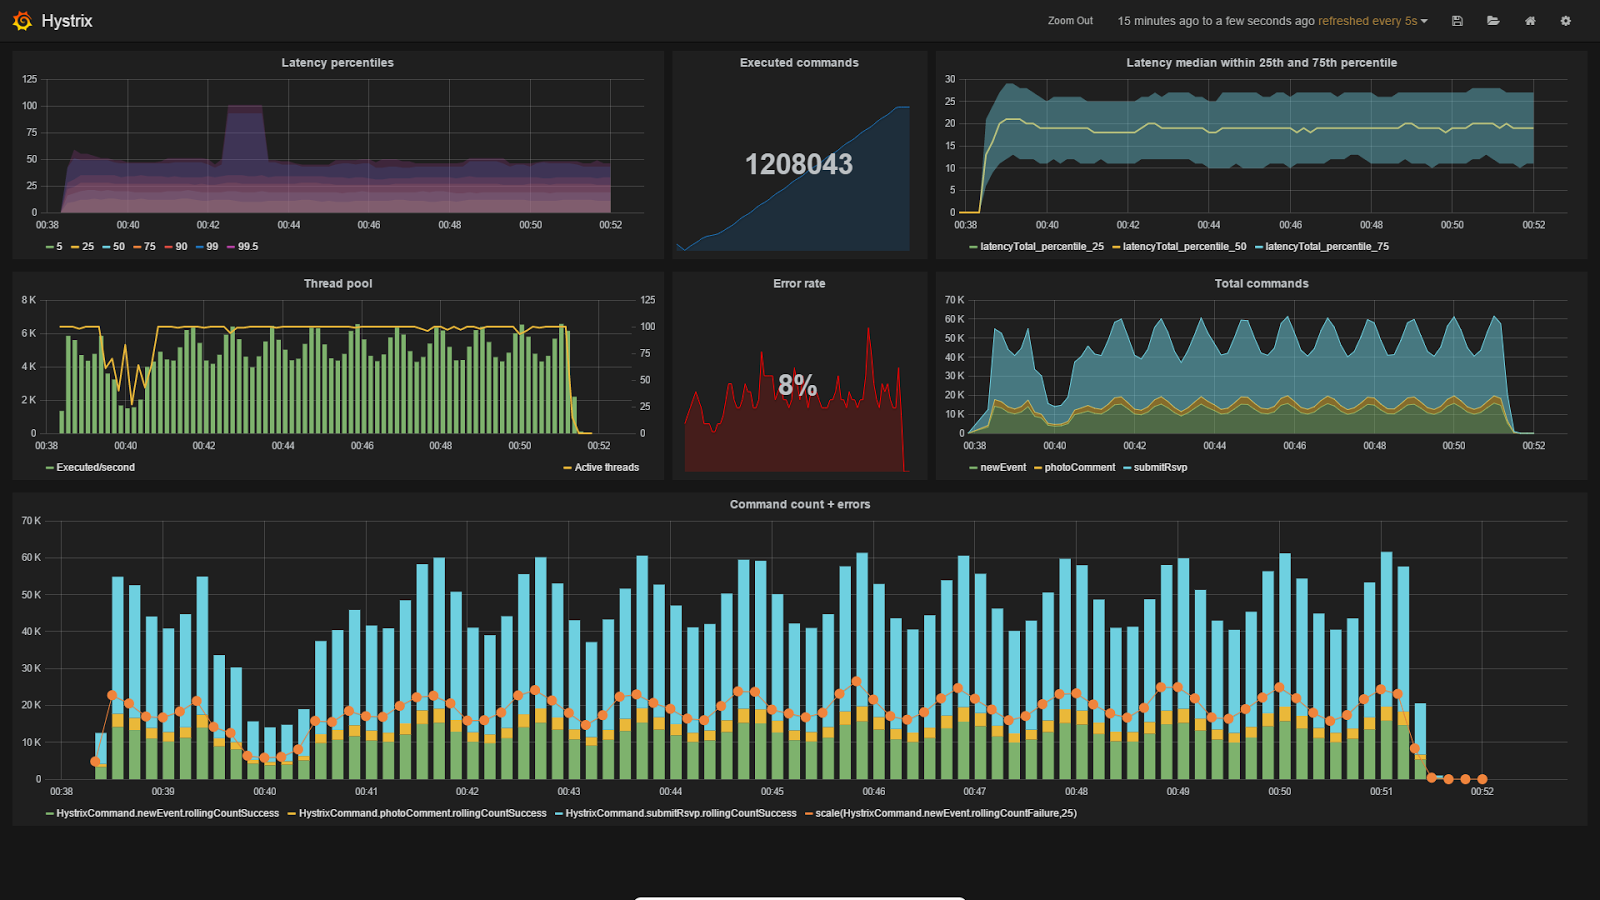
If everything is set up correctly, head straight to localhost:8070 and play around with some dashboards. Here is mine:
New possibilities
Built-in Hystrix dashboard is very responsive and useful. However having days, weeks or even months worth of statistics opens a lot of possibilities. Selection of features unattainable with built-in dashboard, that you can easily setup with Graphite/Grafana:
- Months of statistics (obviously), compared to seconds
- Metrics ignored in standard dashboard, like lower percentiles, total counters, etc.
- Full history of some metrics, rather than instant value (e.g. thread pool utilization)
- Ability to compare seemingly unrelated metrics on single chart, e.g. several different commands latency vs. thread pool queue size – all with full history
- Drill down – look at weeks or zoom in to minutes
Examples can be found on previous screenshot. It totally depends on your use case, but unless your system is on fire, long-term statistics that you can examine hours or weeks after incident are probably more useful than built-in dashboard.
* There is a tiny bug in Hystrix metrics publisher, will be fixed in 1.4.0-RC7
** Features described above are available out-of-the-box in our micro-infra-spring open source project
| Reference: | Storing months of historical metrics from Hystrix in Graphite from our JCG partner Tomasz Nurkiewicz at the Java and neighbourhood blog. |


Can you share json template to create Graphite Dashboard.