Apache Camel Eclipse Tooling with Debugger
About 2 months ago Lars Heineman blogged about improved Apache Camel Eclipse tooling on the way as part of the JBoss Tool stack
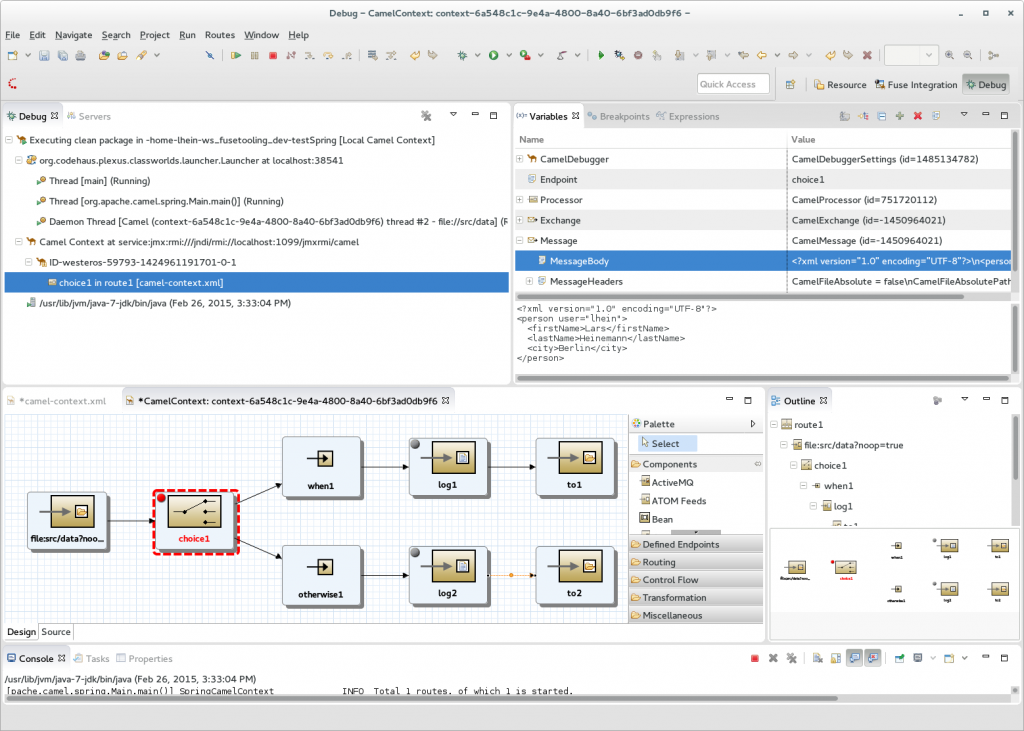
In the upcoming release they have integrated the Camel debugger with the native Eclipse debugger, so you get the Eclipse debugging experience, when you use breakpoints, single step through the Camel routes. And you can of course see all the details of the Camel Exchange and Message on the way. And as well change the data on the fly.
A screenshot is shown below, which I have borrowed from Lars’s blog.

Lars also worked on adding support for editing Camel endpoints uri’s using a properties panel, so each option is provided individually. That work was based on Apache Camel 2.14 that has some support for this.
But since we have improved this tremendously in Apache Camel 2.15, which I recently blogged about. And therefore Lars is currently working on upgrading to Camel 2.15 so the Eclipse Tooling becomes even better.
Now imaging that we take the properties panel based on Camel 2.14 and add all the extra information and documentation we have from Camel 2.15, which will allow Eclipse to present a similar enriched properties panel as hawtio can do.
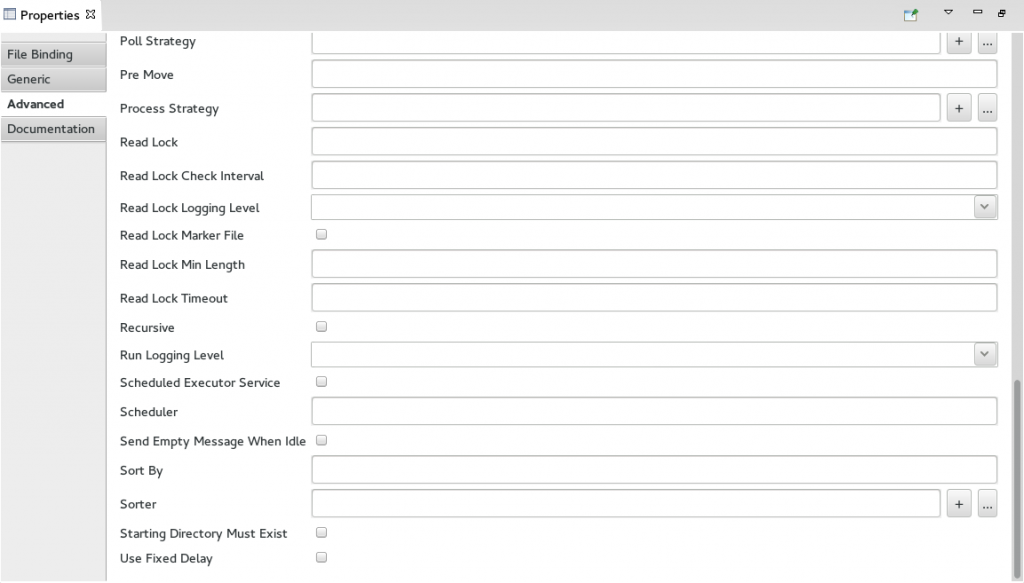
Using Camel 2.14 showing an empty properties panel (no documentation, no information about defaults, required, limited enums, etc, consumer vs producer option etc.)

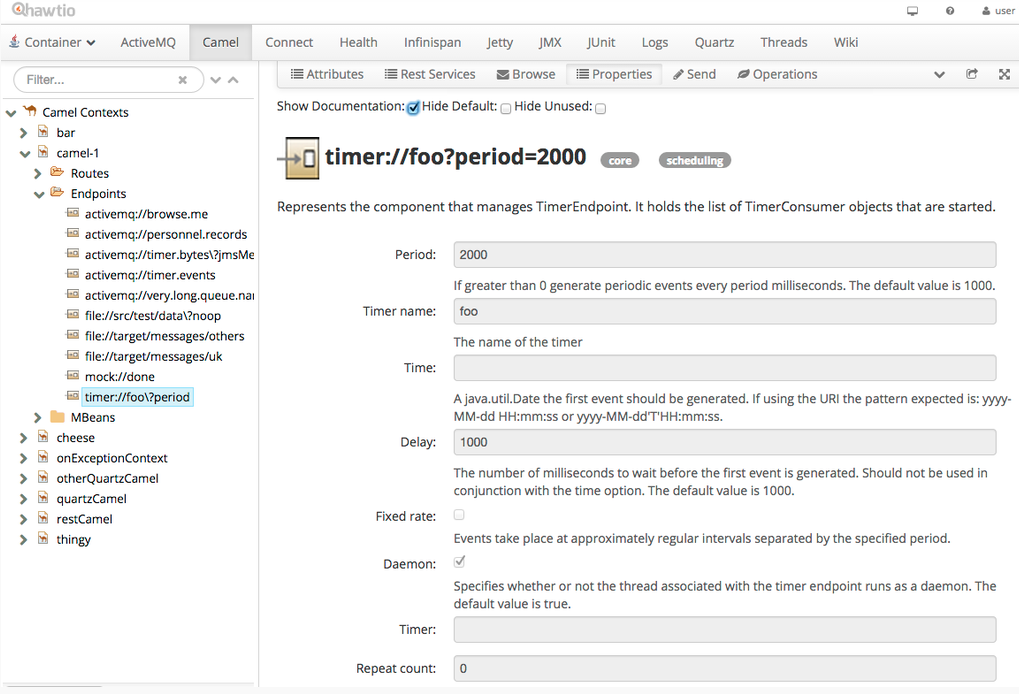
And below the enriched Camel 2.15 which has all of above information, show currently in hawtio.

So imagine that the Eclipse properties panel will be able to include out of the box:
- documentation
- default values
- enum types (eg choices to select among)
- required vs optional
- deprecated
- simple and java type
- option as part of uri path or query parameter
- consumer only option
- producer only option
- custom category for the option (eg security, advanced, etc.)
And with Camel 2.15, we are able to do this for all the components – they all provide all this information.
Camel 2.15 also brings to the table, that it would allow the Eclipse tooling to dynamic generate the EIP palette, as Camel include information about all the EIPs and their options as well. So imagine the Eclipse tooling is able to adjust to which version of Camel you are currently using in the project. And yeah all the EIP options is now documented as well, which the tooling can present to you.
I am really exited about the possibilities that Camel 2.15 brings to the table in terms of tooling and also runtime experience we can enhance.
We also work on JBoss Forge commands that allows to add Apache Camel to existing projects, to dockerize and/or fabric8 enable the projects – that is something for another blog. But as part of this work, we are working on commands to add/edit Camel components/endpoints. So the idea would be they can show all the endpoints uris in your project, and present a nice properties editor for you to have “type safe” editing.
Going back to the title of this blog. Yeah great work Lars and the Eclipse team, we now have a great Apache Camel debugger. And its using the same Camel debugging API that hawtio uses also – no magic trick. In fact this week I was in talk with a company that has built their data integration platform on top of Apache Camel and also leverages its debugging api, to allow its developers and users to debug the deployed Camel routes, on the platform.
| Reference: | Apache Camel Eclipse Tooling with Debugger from our JCG partner Claus Ibsen at the Claus Ibsen riding the Apache Camel blog. |


