Oracle Java Mission Control: The Ultimate Guide
“We love following Mikhail Vorontsov’s blog and getting his point of view on Java Performance related issues. We’ve been asked a few times how Takipi’s Java error analysis differs from Java Mission Control and Java Flight Recorder. So while the differences between the tools are pretty big (Mainly, JMC is mostly a desktop application, while Takipi was specifically designed for large-scale production environments) we felt this would be a good opportunity to add a comprehensive overview of JMC.
Apart from Java Mission Control being a desktop application, the main difference is that with Takipi, you’re getting an always-on error analysis down to the variable values and actual code that caused each error. So where JMC gives great value in profiling, but stops at the stack trace level, Takipi dives into the actual code to help you reproduce and solve production bugs.
Another difference is working with distributed systems, JMC works on single machines, while Takipi’s dashboard displays multiple JVMs across different machines. So if you’re looking to monitor large scale production systems, give Takipi a try. However, if you’re looking for a great desktop profiling tool, JMC just might be your best option.”
– Alex Zhitnitsky, Takipi
New Post: Oracle Java Mission Control: The Ultimate Guide http://t.co/UaxThmzq61 pic.twitter.com/i0UScStu9u
— OverOps (@overopshq) March 23, 2015
Mikhail is the principal blogger at java-performance.info. He makes his Java apps 5% faster and more compact over and over again at work. Mikhail likes to spend his time gardening and playing with his son in one of Sydney (Australia) suburbs.
Table of Contents
1. Introduction
2. Java Mission Control
3. JMC Licence
4. Realtime Process Monitoring
– 4.1 Event Triggers
– 4.2 Memory Tab
– 4.3 Threads Tab
5. Using Java Flight Recorder
– 5.1 How To Run
– 5.2 Initial Screen
– 5.3 Memory Tab
– 5.4 Allocations Tab
– – 5.4.1 By Class
– – 5.4.2 By Thread
– – 5.4.3 Allocation Profile
– 5.5 Code Tab
– – 5.5.1 Hot Methods
– – 5.5.2 Exceptions Tab
– – 5.5.3 Threads Tab
– – 5.5.4 I/O Tab
6. The Java Production Tooling Ecosystem
1. Introduction
This article will describe the Java Mission Control – a JDK GUI tool available since Java 7u40, together with Java Flight Recorder.
2. Java Mission Control
Oracle Java Mission Control is a tool available in the Oracle JDK since Java 7u40. This tool originates from JRockit JVM where it was available for years. JRockit and its version of JMC were well described in a Oracle JRockit: The Definitive Guidebook written by two JRockit senior developers (Also visit the Marcus Hirt blog – the first place you should be looking for any JMC news).
Oracle JMC could be used for 2 main purposes:
- Monitoring the state of multiple running Oracle JVMs
- Java Flight Recorder dump file analysis
3. JMC license
Current JMC license (See “Supplemental license terms” here) allows you to freely use JMC for development, but it requires the purchase of a commercial license if you want to use it in production.
4. Realtime process monitoring
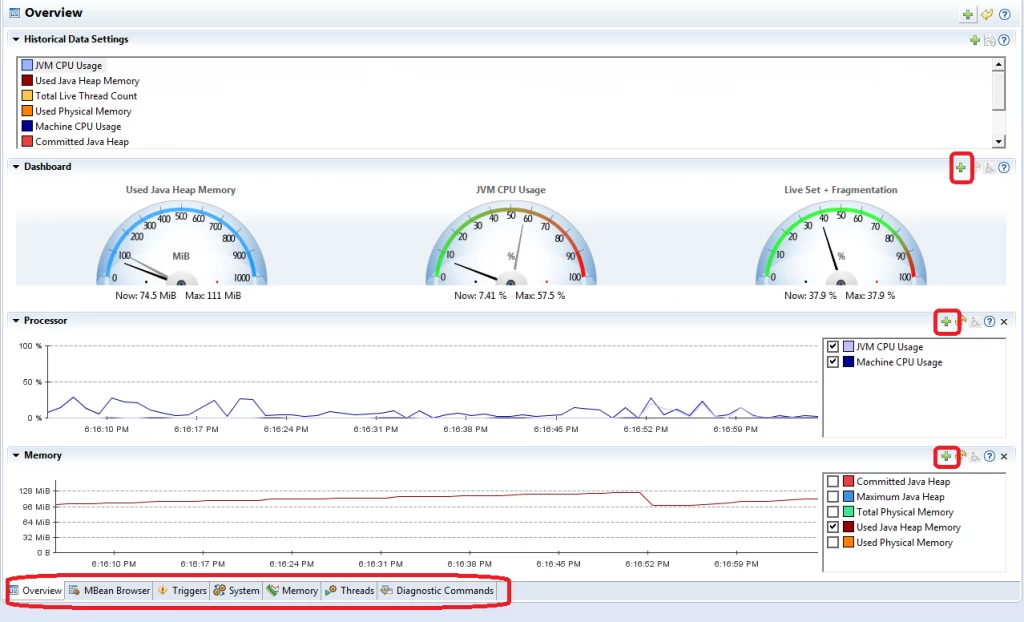
You can attach to a JVM by right-clicking on it in the JVM Browser tab of the main window and choosing “Start JMX Console” menu option. You will see the following screen. There is nothing fancy here, just pay attention to the “+” buttons which allow you to add more counters to this screen.
4.1 Event triggers
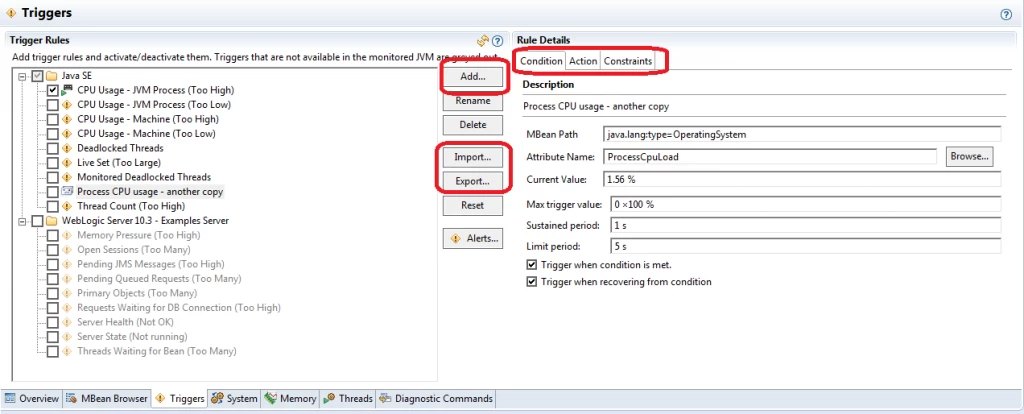
Triggers allow you to run various actions in response to certain JMX counters exceeding and (optionally) staying above the threshold for a given period of time. For example, you can trigger the JFR recording in case of long enough high CPU activity in order to understand what component is causing it (and you are not limited to a single recording!).
Note that triggers are working on any JMX counter (do you see the “Add…” button?) – you can setup more triggers than available in the standard distribution and export the settings on disk. You can even work with your own application JMX counters.
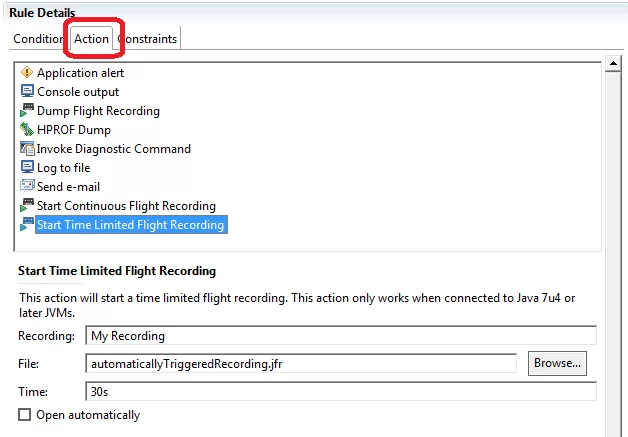
Go to the “Action” tab in the “Rule Details” window – here you can specify which action do you want to execute in case of an event.
Note that you need to run your app in at least Java 7 update 40 if you want to properly use JFR – I was not able to record any events from JREs prior to Java7u40 (maybe this was a bug or incompatibility between certain JRE versions…).
4.2 Memory tab
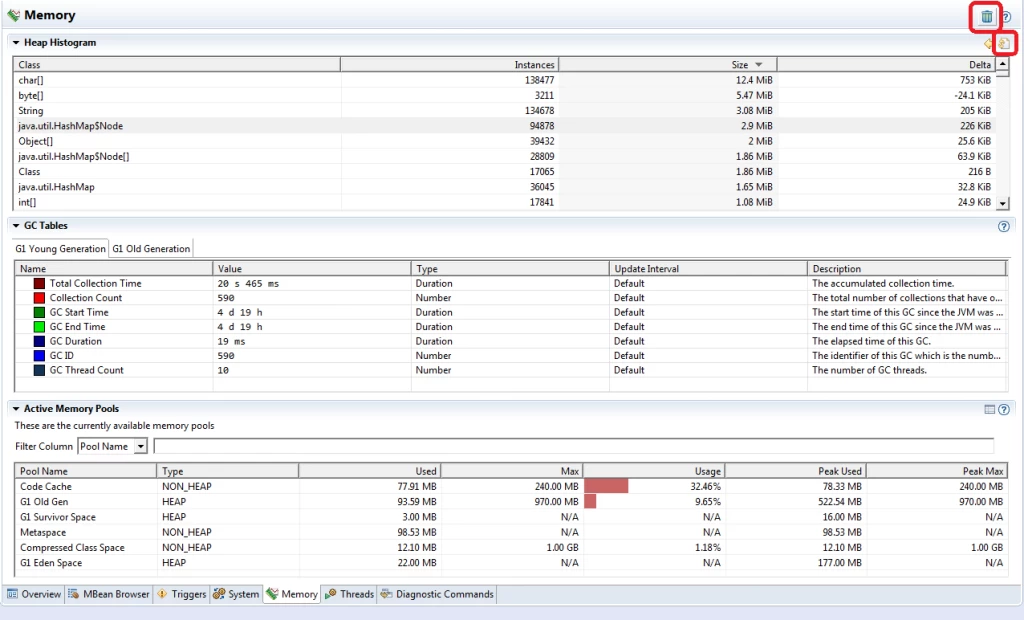
The next tab – “Memory” will provide you the summary information about your application heap and garbage collection. Note that you can run the full GC and request a heap dump from this page (highlighted on the screen shot). But in essence this page is just a nice UI around the functionality available via the other sources.
4.3 Threads tab
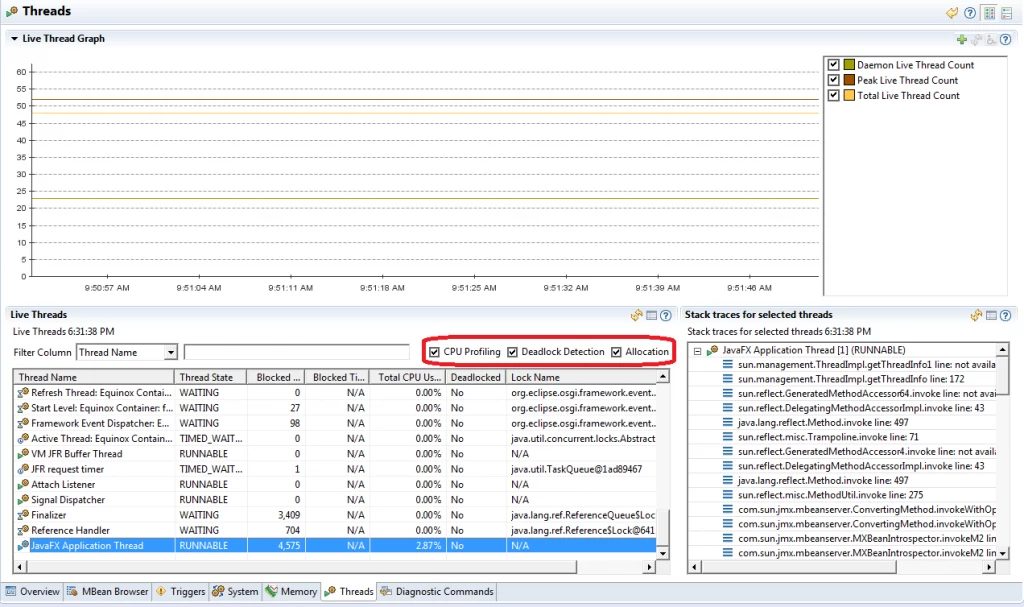
This tab allows you to see a list of running threads in your app with their current stack dumps (updated once a second). It also lets you see:
- Thread state – running or blocked / waiting
- Lock name
- If a thread is deadlocked
- The number of times a thread was blocked
- Per thread CPU usage!
- Amount of memory allocated by a given thread since it was started
Remember that you have to turn on CPU profiling, deadlock detection and memory allocation tracking to obtain that information in realtime mode:
5. Using Java Flight Recorder
Java Flight Recorder (we will call it JFR in the rest of this article) is a JMC feature. From the user point of view, you run the JFR with a fixed recording time / maximum recording file size / maximum recording length (your app can finish before that) and wait until recording is complete. After that you analyze it in the JMC.
5.1 How to run JFR
You need to add 2 following options to the JVM you want to connect to:
1 | -XX:+UnlockCommercialFeatures -XX:+FlightRecorder |
Next, if you want to get anything useful from JFR, you need to connect to Java 7u40 or newer. Documentation claims that you can connect to any JVM from Java 7u4, but I was not able to get any useful information from those JVMs.
The third thing to keep in mind is that by default, the JVM allows to make stack traces only at safe points. As a result, you may have incorrect stack trace information in some situations. JFR documentation tells you to set 2 more parameters if you want the more precise stack traces (you will not be able to set those parameters on the running JVM):
1 | -XX:+UnlockDiagnosticVMOptions -XX:+DebugNonSafepoints |
Finally, if you want as much file I/O, Java exceptions and CPU profiling info available, ensure that you have selected parameters enabled and their thresholds set to “1 ms”.
5.2 JFR Initial Screen
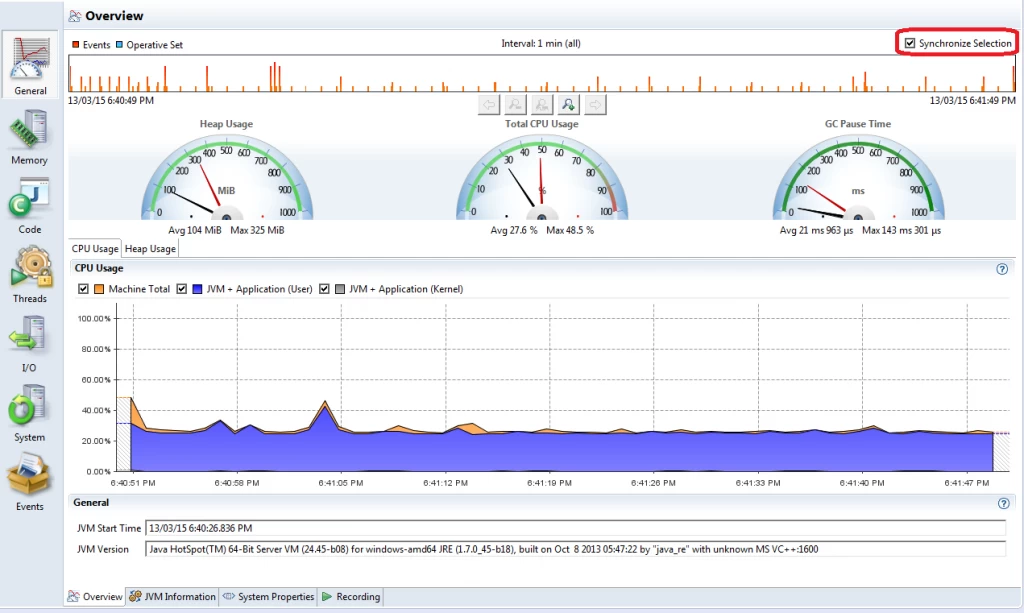
The initial screen of JFR recording contain CPU and heap usage charts over the recording periods. Treat it just as an overview of your process. The only thing you should notice on this (and other JFR screens) is the ability to select a time range to analyze via any chart. Tick “Synchronize Selection” checkbox to keep the same time range on each window – it will allow you to inspect events happened at this range only.
There is one more interesting feature on this screen: “JVM Information” tab at the bottom contains the values of all JVM parameters set in the profiled JVM. You can obtain them via -XX:+PrintFlagsFinal JVM option, but getting them remotely via UI is more convenient:
5.3 Java Flight Recorder Memory tab
The memory tab provides you the information about:
- Machine RAM and Java heap usage (You can easily guess if swapping or excessive GC happened during the recording).
- Garbage collections – when, why, for how long and how much space was cleaned up.
- Memory allocation – inside / outside TLAB, by class/thread/stack trace.
- Heap snapshot – number / amount of memory occupied by class name
Essentially, this tab will allow you to check the memory allocation rate in your app, the amount of pressure it puts on GC and which code paths are responsible for unexpectedly high allocation rates. JFR also has its own very special feature – it allows to track TLAB and global heap allocations separately (TLAB allocations are much faster, because they do not require any synchronization).
In general, your app will get faster if:
- It allocates less objects (by count and amount of allocated RAM)
- You have less old (full) garbage collections, because they are slower and require stopping the world (at least for some time)
- You have minimized non-TLAB object allocations
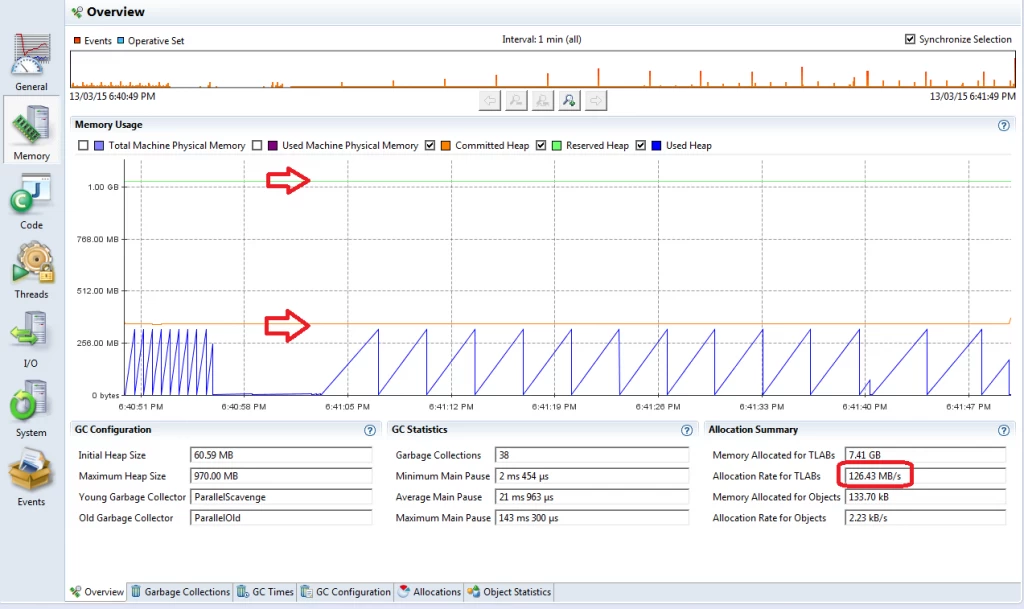
Let’s see how you can monitor this information. An “Overview” tab shows you the general information about memory consumption/allocation/garbage collection.
You can see here how far is “Committed Heap” from “Reserved Heap”. It shows you how much margin do you have in case of input spikes. The blue line (“Used Heap”) shows how much data is leaking/staying in the old generation: If your saw pattern is going up with each step – your old generation is growing. The lowest point of each step approximately shows the amount of data in the old generation (some of it may be eligible for garbage collection). The pattern on the screenshot tells that an application is allocating only the short-living objects, which are collected by the young generation GC (it may be some stateless processing).
You can also check “Allocation rate for TLABs” field – it shows you how much memory is being allocated per second (there is another counter called “Allocation rate for objects”, but it should be pretty low in general). 126 Mb/sec (in the example) is a pretty average rate for batch processing (compare it with a HDD read speed), but pretty high for most of interactive apps. You can use this number as an indicator for overall object allocation optimizations.
The 3 following tabs: “Garbage Collections”, “GC Times” and “GC Configuration” are pretty self evident and could be a source of information about reasons of GCs and the longest pauses caused by GC (which affect your app latency).
5.4 Java Flight Recorder Allocations tab
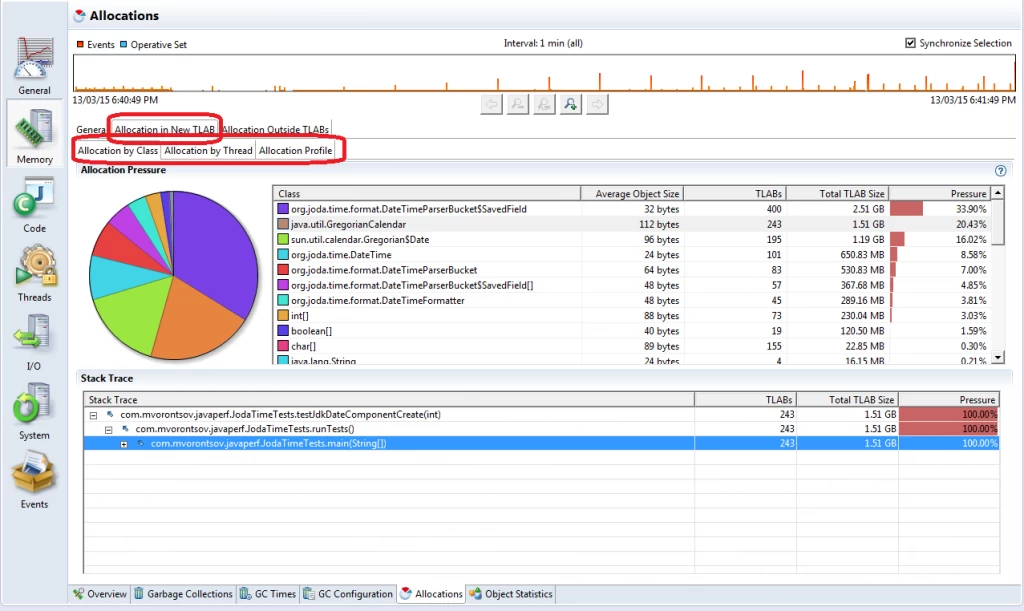
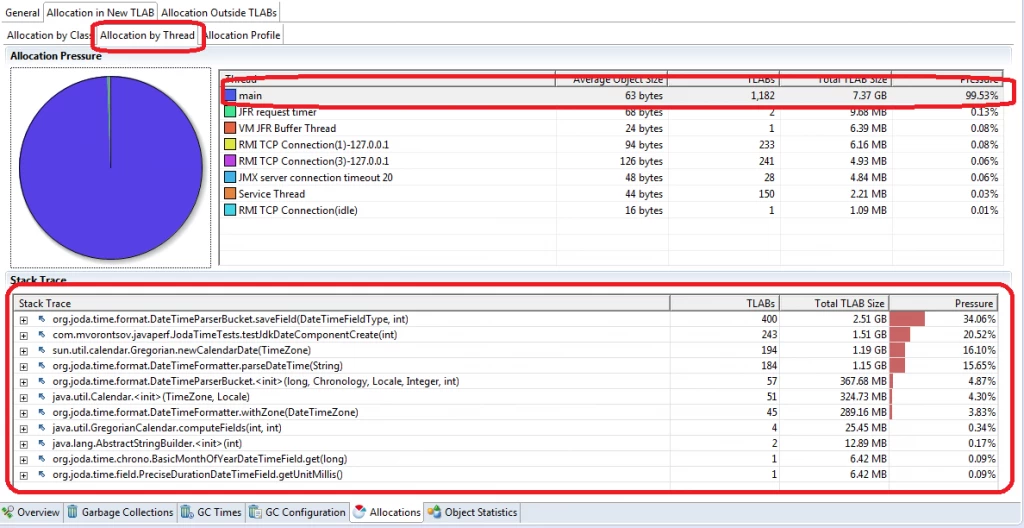
The “Allocations” tab provides you with the information about all object allocations. You should go to the “Allocation in the new TLAB” tab. Here you can see the object allocation profiles per class (which class instances are being allocated), per thread (which threads allocate most of the objects) or per call stack (treat it as global allocation information).
5.4.1 Allocation by Class
Let’s see what you can find out from each of these tab. The first one (on the screenshot above), “Allocation by Class” lets you see which classes are allocated most of all. Select a type in the middle tab and you will get allocation stats (with stack traces) for all allocations of this class instances.
The first check you should make here is if you can find any “useless” object allocations: any primitive wrappers like Integer or Double (which often indicate use of JDK collections), java.util.Date, java.util.GregorianCalendar, Pattern, any formatters, etc. I have written some memory tuning hints in the second part of my recent article. The “Stack Trace” tab will let you find the code to improve.
Another problem to check is the excessive object allocations. Unfortunately, no general advices could be given here – you should use your common sense to understand what “excessive” means in your application. The common issues are useless defensive copying (for read-only clients) and excessive use of String.substring since the String class changes in Java 7u6.
5.4.2 Allocation by Thread
The “Allocation by Thread” tab could be interesting if you have several data processing types of threads in your application (or you could distinguish which tasks run by which threads) – In this case you can figure out the object allocations per thread:
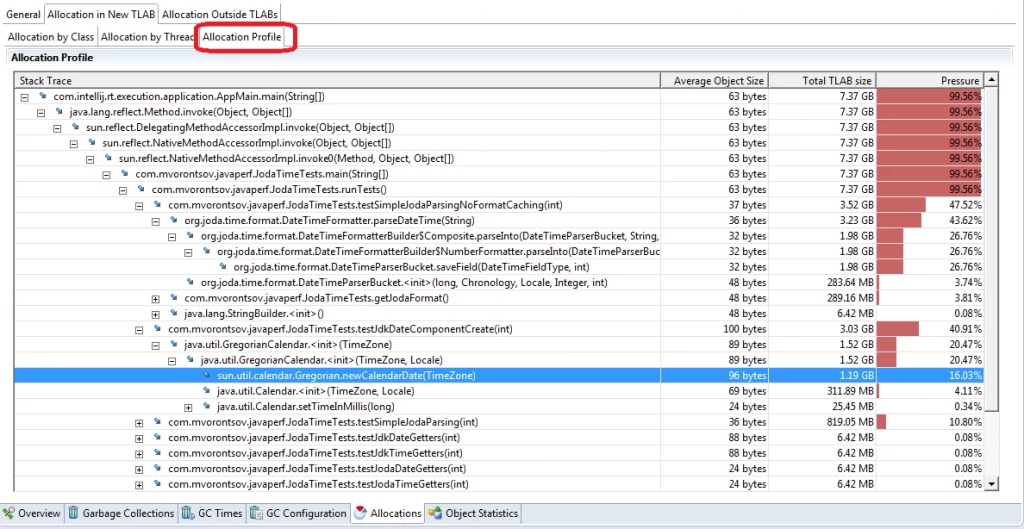
5.4.3 Allocation Profile
If all your threads are uniform (or you just have one data processing thread) or you simply want to see the high level allocation information, then go to the “Allocation Profile” tab directly. Here you will see how much memory have been allocated on each call stack in all threads.
This view allows you to find the code paths putting the highest pressure on the memory subsystem. You should distinguish the expected and excessive allocations here. For example, if from method A you call method B more than once and method B allocates some memory inside it and all invocations of method B are guaranteed to return the same result – it means you excessively call method B. Another example of excessive method calls/object allocation could be a string concatenation in the Logger.log calls. Finally, beware of any optimizations which force you to create a pool of reusable objects – you should pool/cache objects only if you have no more than one stored object per thread (the well known example is ThreadLocal<DateFormat>).
5.5 Java Flight Recorder Code Tab
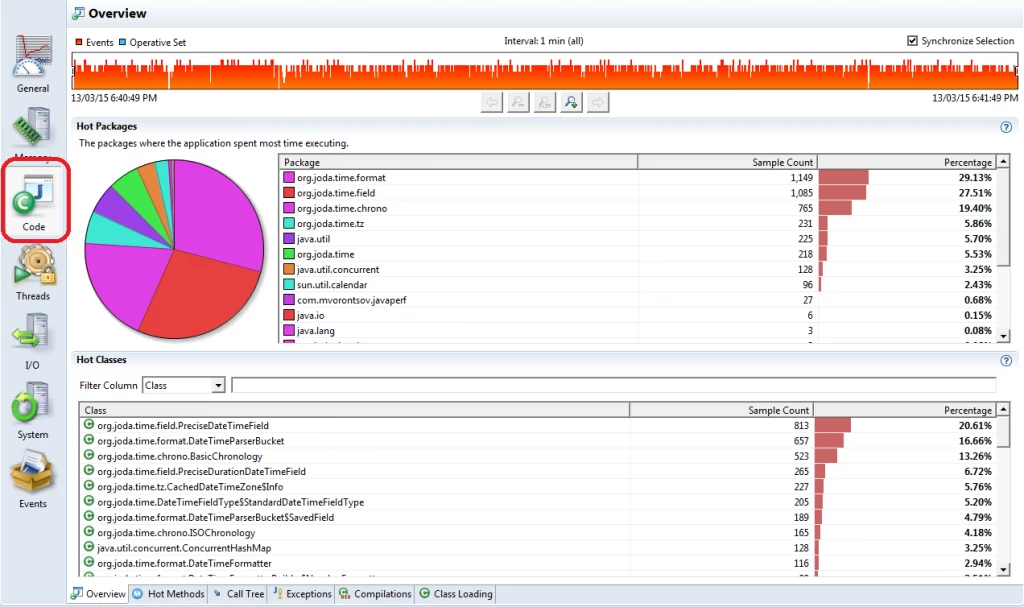
The next large tab in the JFR view is the “Code” tab. It is useful for CPU optimization:
The overview tab provides you with 2 views: “Hot packages”, where you can see time spent per Java package and “Hot classes”, which allows you to see the most CPU expensive classes in your application.
“Hot packages” view may be useful if you use some 3rd party libs over which you have very little control and you want a CPU usage summary for your code (one package), 3rd party code (a few other packages) and JDK (a few more packages). At the same time, I’d call it “CIO/CTO view”, because it is not interactive and does not let you to see which classes from those packages are to blame. As a developer, you’d better use filtering on most of other tables in this tab:
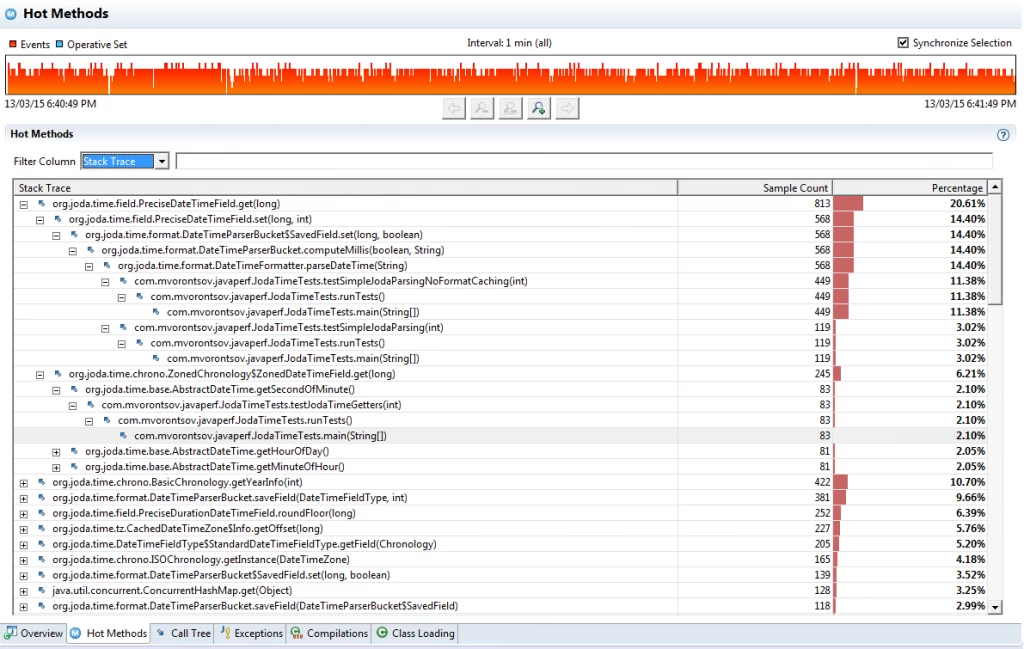
5.5.1 Hot Methods / Call Tree Tabs
“Hot Methods” and “Call Tree” tabs are the ordinary views provided by literally any Java profiler. They show your app hot spots – methods where your application has spent most of time as well as code paths which lead to those hot spots. You should generally start your app CPU tuning from “Hot Methods” tab and later check if an overall picture is sane enough in the “Call Tree” tab.
You should be aware that all “low impact” profilers are using sampling to obtain CPU profile. A sampling profiler makes a stack trace dump of all application threads periodically. The usual sampling period is 10 milliseconds. It is usually not recommended to reduce this period to less than 1 ms, because the sampling impact will start getting noticeable.
As a result, the CPU profile you will see is statistically valid, but is not precise. For example, you may be unlucky to hit some pretty infrequently called method right at the sampling interval. This happens from time to time… If you suspect that a profiler is showing you the incorrect information, try reorganizing the “hot” methods – inline the method into its caller on the hottest path, or on the contrary, try to split the method in 2 parts – it may be enough to remove a method from the profiler view.
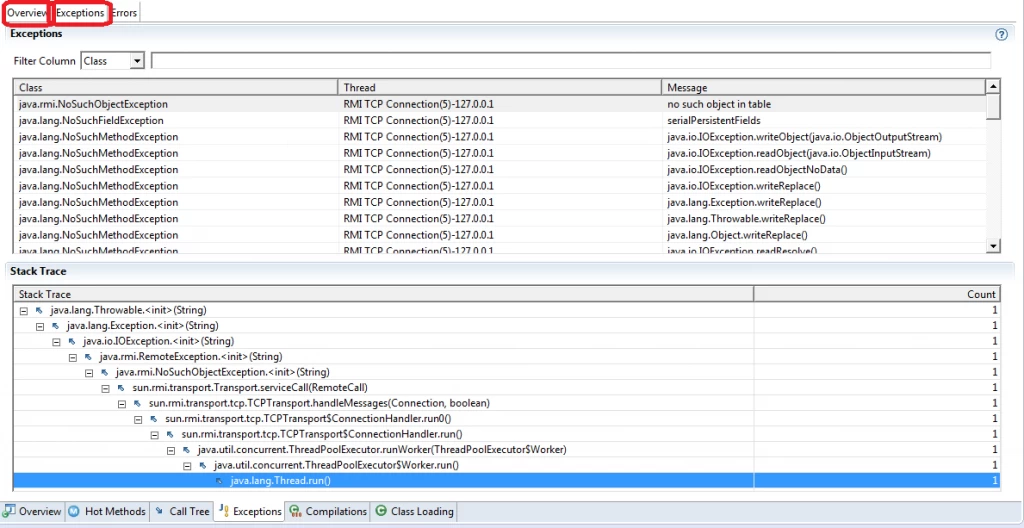
5.5.2 Exceptions Tab
The “Exceptions” tab is the last tab in the “Code” view which worth attention in the general optimization case. Throwing Java exceptions is very slow and their usage must be strictly limited to the exceptional scenarios in high performance code.
Exceptions view will provide you the stats about the number of exceptions which were thrown during recording as well as their stack traces and details. Go through the “Overview” tab and check if you see:
- Any unexpected exceptions
- Unexpected number of expected exceptions
If you see anything suspicious, go to “Exceptions” tab and check the exception’s details. Try to get rid of at least the most numerous ones.
5.6 JFR Threads Tab
JFR Threads Tab provides you the following information:
- CPU usage / Thread count charts
- Per thread CPU profile – similar to the one on the Code tab, but on per thread basis
- Contention – which threads were blocked by which threads and for how long
- Latencies – what caused application threads to go into the waiting state (you will clearly see some JFR overhead here)
- Lock instances – locks which have caused thread contention
I would not cover this tab in details in this article, because you need this tab only for pretty advanced optimizations like lock stripping, atomic / volatile variables, non-blocking algorithms and so on.
5.7 JFR I/O Tab
I/O Tab should be used for inspection of file and socket input/output in your application. It lets you see which files your application was processing, what were the read/write sizes and how long did it take to complete the I/O operation. You can also see the order of I/O events in your app.
As with most of other Java Flight Recorder tabs, you need to interpret the output of this tab yourself. Here are a few example questions you could ask yourself:
- Do I see any unexpected I/O operations (on files I don’t expect to see here)?
- Do I open/read/close the same file multiple times?
- Are the read/write block sizes expected? Aren’t they too small?
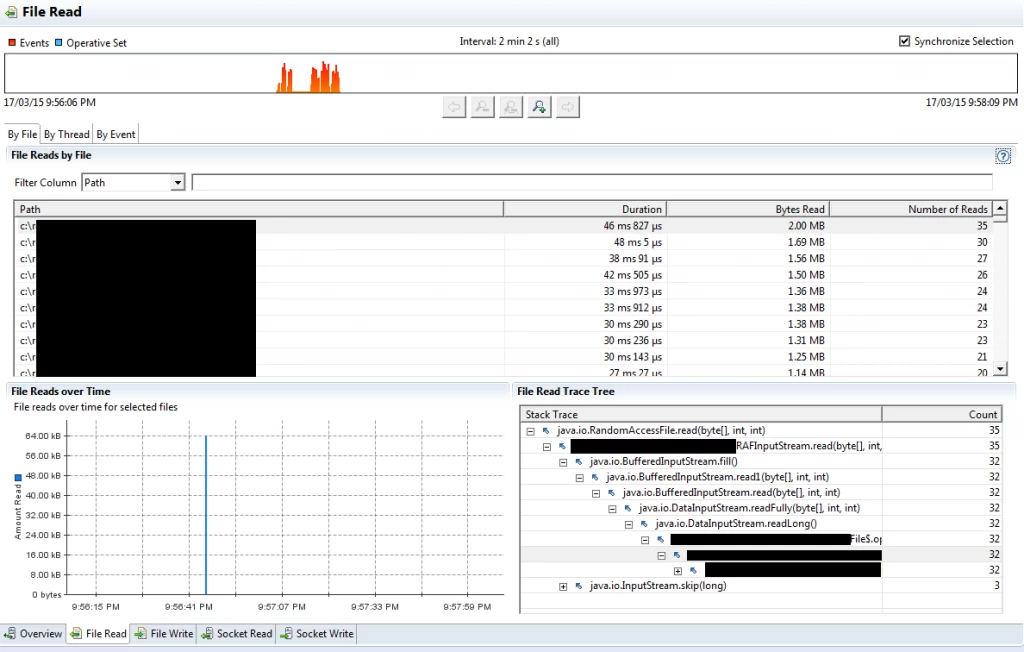
Please note that it is highly recommended to reduce the “File Read Threshold” JFR parameter (you can set it up while starting the JFR recording) to 1 ms if you are using an SSD. You may miss too many I/O events on SSD with the default 10 ms threshold. The I/O “Overview” tab is great, but it does not provide you any extra information compared to the following 4 specialized tabs. Each of 4 specialized tabs (File read/write, Socket read/write) are similar to each other, so let’s look just at one of them – “File Read”.
There are 3 tabs here: “By File”, “By Thread” and “By Event”. The 2 first tabs group operations by file and by thread. The last tab simply lists all I/O events, but it may be pretty useful if you are investigating which operations were made on particular file (filter by “Path”) or if you want to figure out if you have made read requests for short chunks of data (sort by “Bytes Read”), which hurt the application performance. In general, you should always buffer the disk reads, so that only the file tail read would be shorter than a buffer size.
Note that the I/O information is collected via sampling as well, so some (or a lot) of file operations will be missing from I/O tab. This could be especially noticeable on the top range SSDs.
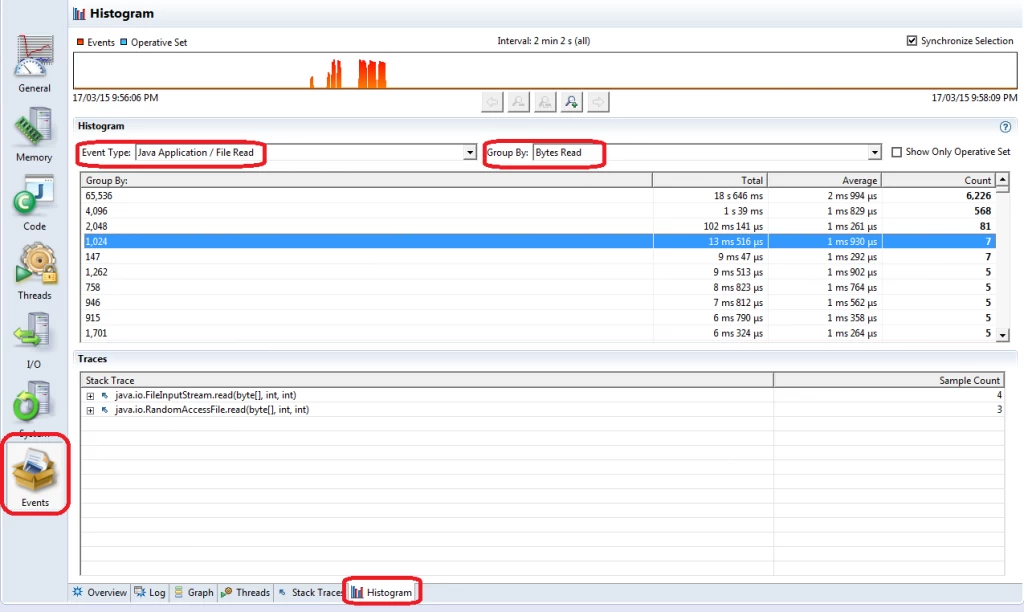
There is one more related screen which will allow you to group I/O (and some other) events by various fields. For example, you may want to find out what number of read operations have read a given number of bytes (and check their stack traces). Go to the “Events” tab on the left of JFR view and then to the very last tab called “Histogram”.
Here you can filter/sort/group various events by the available columns. Each JFR event has a related stack trace, so you can see the stack trace information for the selected events:
There is one basic performance tuning area not covered by JFR: memory usage antipatterns, like duplicate strings or nearly empty collections with a huge capacity. JFR does not provide you such information because you need a heap dump to make such analysis. That’s where you need a JMC plugin called “JOverflow Analysis”.
6. The Java Production Tooling Ecosystem
In previous posts on Takipi we’ve covered the Java tooling ecosystem for use in production. If you’d like to discover more new tools, you can check out the following posts:
- 15 Tools Java Developers Should Use After a Major Release
- Async Goes Mainstream: 7 Reactive Programming Tools You Must Know
- 7 New Tools Java Developers Should Know
| Reference: | Oracle Java Mission Control: The Ultimate Guide from our JCG partner Mikhail Vorontsov at the Takipi blog. |

