How to Debug Your Maven Build with Eclipse
When running a Maven build with many plugins (e.g. the jOOQ or Flyway plugins), you may want to have a closer look under the hood to see what’s going on internally in those plugins, or in your extensions of those plugins. This may not appear obvious when you’re running Maven from the command line, e.g. via:
C:\Users\jOOQ\workspace>mvn clean install
Luckily, it is rather easy to debug Maven. In order to do so, just create the following batch file on Windows:
@ECHO OFF

IF "%1" == "off" (
    SET MAVEN_OPTS=
) ELSE (
    SET MAVEN_OPTS=-Xdebug -Xnoagent -Djava.compile=NONE -Xrunjdwp:transport=dt_socket,server=y,suspend=y,address=5005
)
Of course, you can do the same also on a MacOS X or Linux box, by using export intead of SET.
Now, run the above batch file and proceed again with building:
C:\Users\jOOQ\workspace>mvn_debug

C:\Users\jOOQ\workspace>mvn clean install
Listening for transport dt_socket at address: 5005
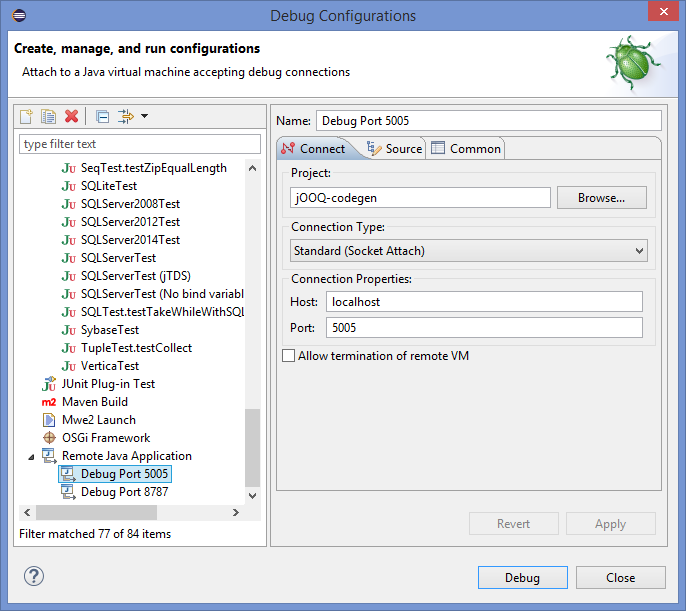
Your Maven build will now wait for a debugger client to connect to your JVM on port 5005 (change to any other suitable port). We’ll do that now with Eclipse. Just add a new Remote Java Application that connects on a socket, and hit “Debug”:
That’s it. We can now set breakpoints and debug through our Maven process like through any other similar kind of server process. Of course, things work exactly the same way with IntelliJ or NetBeans.
Once you’re done debugging your Maven process, simply call the batch again with parameter off:
C:\Users\jOOQ\workspace>mvn_debug off

C:\Users\jOOQ\workspace>mvn clean install
And your Maven builds will no longer be debugged.
Happy debugging!
| Reference: | How to Debug Your Maven Build with Eclipse from our JCG partner Lukas Eder at the JAVA, SQL, AND JOOQ blog. |


Also a nice article about that topic: Debugging Maven