One and the Only One Reason to Customize IntelliJ IDEA Memory Settings
Don’t be a Scrooge and give your IDE some more memory
Yesterday we had a discussion about customizing memory settings in IntelliJ IDEA and it appeared that some people do not do that, some people (like me) use some simple changeset and some developers craft a fancy, sophisticated setup that satisfy their needs. While working for a current project I had to deal with several small microservices projects and one older project, a core of the client’s business which is quite big. And after applying some changes I have noticed really significant improvement when it comes to IDE speed and responsiveness. But at that time I didn’t measure what exactly changed, it was only a subjective observation that “IDEA is now faster”.
But during that discussion one of the developers working for the same client (thank you Yuri) sent me his settings and I was really overwhelmed by their level of complexity. I was happy with my own setup, but I was also curious how those completely different settings compare to each other and also how they compare to defaults provided by JetBrains. So after discussion with Yuri I knew that this is a good material for a blog post.
Goal
My plan is to compare how different IDEA memory settings perform in a scenario close to my daily usage (load big project, load two or three microservices, refresh big project after hypothetical git pull) and then choose the most optimal settings when it comes to memory consumption and speed improvement.
Test machine and projects
Laptop: MacBook Pro Retina, 2,3GHz Intel Core i7, 16GB 1600Mhz DDR3, SSD Disc, OS X Yosemite
Projects
- Big Project – monolith, 700 000 lines of code (Java 8 and Groovy), 303 Gradle modules
- Two microservices – small projects with 10 000 – 20 000 lines of code (Java 8 and Groovy), each with one Gradle module
Test scenario
- Close all projects in Idea
- Put settings under test to idea.vmoptions file
- Reset my laptop
- After a start close all unrelated programs (communicators, etc.)
- Open Idea (measure time)
- Open Big Project (measure time)
- Check jstat -gcutil
- Open two more projects: Microservice One and Microservice Two (measure times)
- Check jstat -gcutil
- Go back to Big Project and click “Refresh Gradle project” button (measure time)
- Check jstat -gcutil
What is jstat -gcutil
jstat is a tool available in your JDK to monitor JVM and Garbage Collector statistics. It has many different options to collect various data (full documentation is here) but we are interested in only one: -gcutil:
-gcutil - Summary of garbage collection statistics.

S0: Survivor space 0 utilization as a percentage of the space's current capacity.
S1: Survivor space 1 utilization as a percentage of the space's current capacity.
E: Eden space utilization as a percentage of the space's current capacity.
O: Old space utilization as a percentage of the space's current capacity.
M: Metaspace utilization as a percentage of the space's current capacity.
CCS: Compressed class space utilization as a percentage.
YGC: Number of young generation GC events.
YGCT: Young generation garbage collection time.
FGC: Number of full GC events.
FGCT: Full garbage collection time.
GCT: Total garbage collection time.
Example output from this command looks like this:
S0     S1    E     O     M    CCS  YGC YGCT FGC  FGCT   GCT
89.70 0.00 81.26 74.27 95.68 91.76 40 2.444 14  0.715  3.159
In this post the most important parameters are number of GC events (YGC and FGC) and collection times (YGCT and FGCT).
Tested settings
I have tested four different settings, to make reading easier each of them was given a name.
Default (grey)
These are built-in settings provided by JetBrains, clean IDEA 15 is using them:
-Xms128m
-Xmx750m
-XX:MaxPermSize=350m
-XX:ReservedCodeCacheSize=240m
-XX:+UseCompressedOops
Big (red)
4096MB for Xmx and 1024MB for ReservedCodeCacheSize, that’s quite a lot of memory.
-Xms1024m
-Xmx4096m
-XX:ReservedCodeCacheSize=1024m
-XX:+UseCompressedOops
Balanced (blue)
2GB for Xmx and 2GB for Xms, more balanced approach to the memory consumption
-Xms2g
-Xmx2g
-XX:ReservedCodeCacheSize=1024m
-XX:+UseCompressedOops
Sophisticated (orange)
2GB for Xmx and 2GB for Xms as above, but different Garbage Collector is specified and many different flags for GC and memory management. I have received these settings from Yuri.
-server
-Xms2g
-Xmx2g
-XX:NewRatio=3
-Xss16m
-XX:+UseConcMarkSweepGC
-XX:+CMSParallelRemarkEnabled
-XX:ConcGCThreads=4
-XX:ReservedCodeCacheSize=240m
-XX:+AlwaysPreTouch
-XX:+TieredCompilation
-XX:+UseCompressedOops
-XX:SoftRefLRUPolicyMSPerMB=50
-Dsun.io.useCanonCaches=false
-Djava.net.preferIPv4Stack=true
-Djsse.enableSNIExtension=false
-ea
So these are our test setups. To perform our test scenarios we have to create a file idea.vmoptions under ~/Library/Preferences/IntelliJIdea15/ (it is Mac OS specific, to see how change these settings for your OS, check this article).
Now it is time to perform our test scenarios and compare the results.
Results
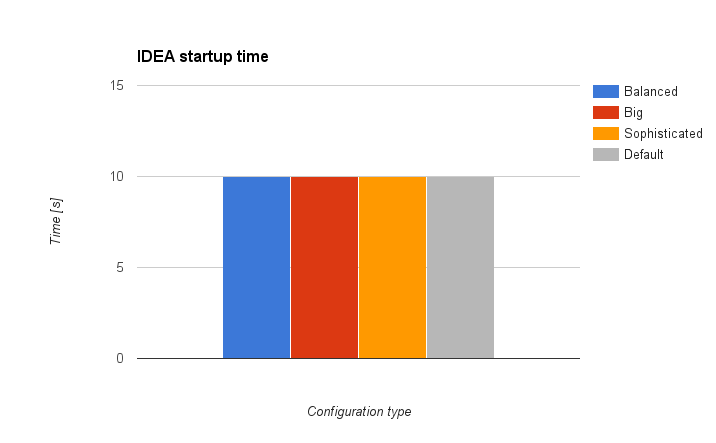
Idea startup time
As you can see startup time does not depend on memory settings. Idea startup time is about 10 seconds for all test scenarios no matter how many memory we allocate. And this is not a surprise as those settings should not affect application behaviour in such early stage.
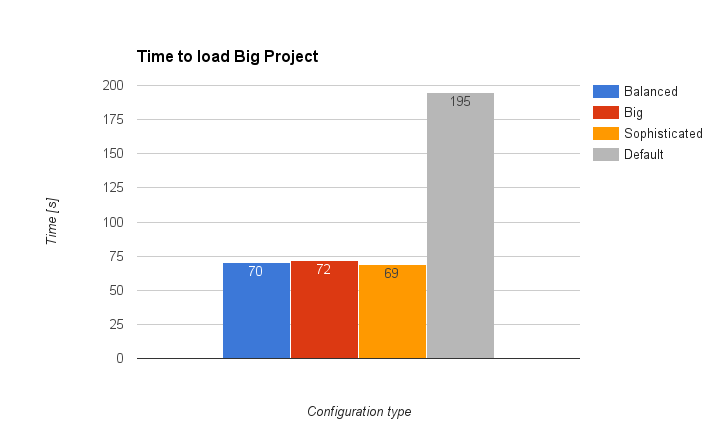
Time to load The Big Project
Ok, so now it is time to load our Monolith and its 700k lines of code.
Finally there are some differences. Default settings performs almost three times worse than the rest. Apparently so large codebase needs more memory :) And if we execute
jstat -gcutil <IDEA_PID>
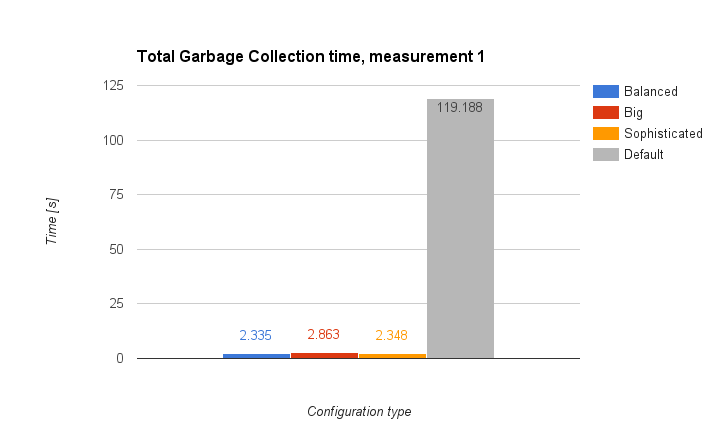
we will notice that Garbage Collector was really, really busy with default settings when we compare it other setups.
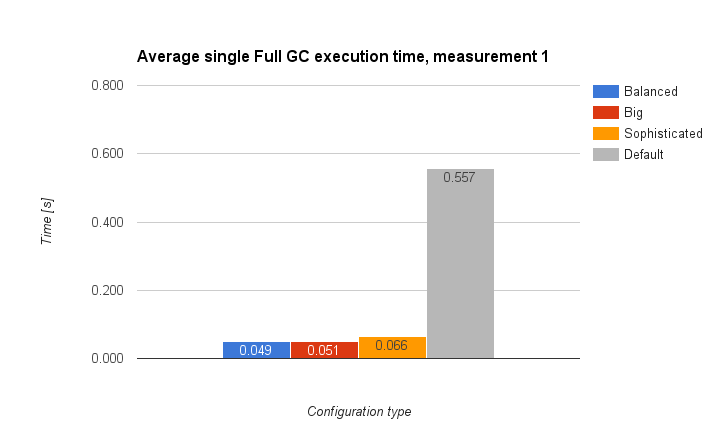
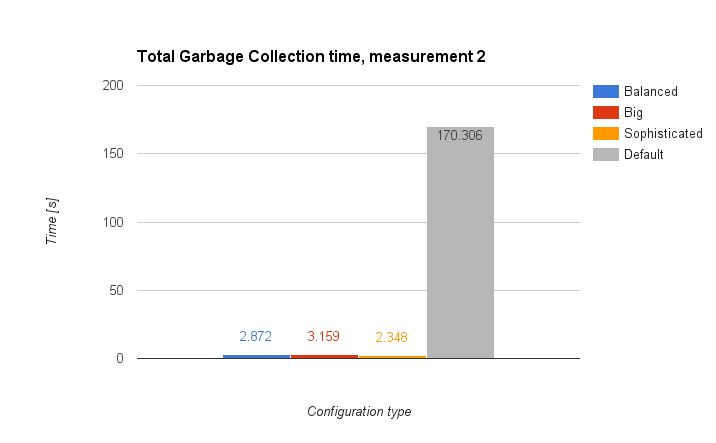
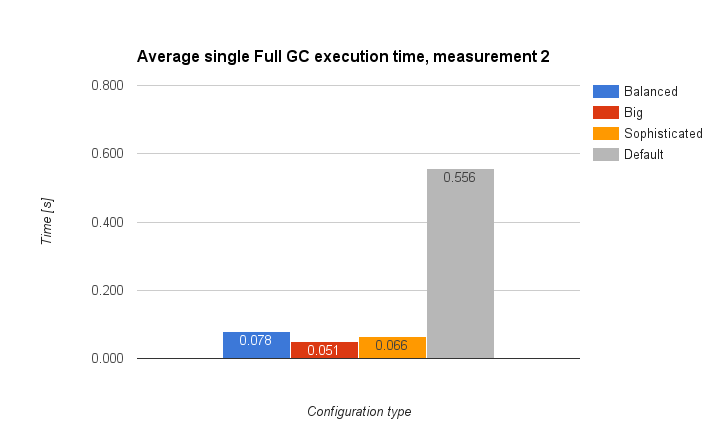
Not only total time spent by GC on freeing memory is dramatically higher (about 50 times higher) but also average execution time of Full GC is much, much longer. Long periods spent on Full GCs are the main cause of low responsiveness of our IDE.
Opening two microservices in IDEA
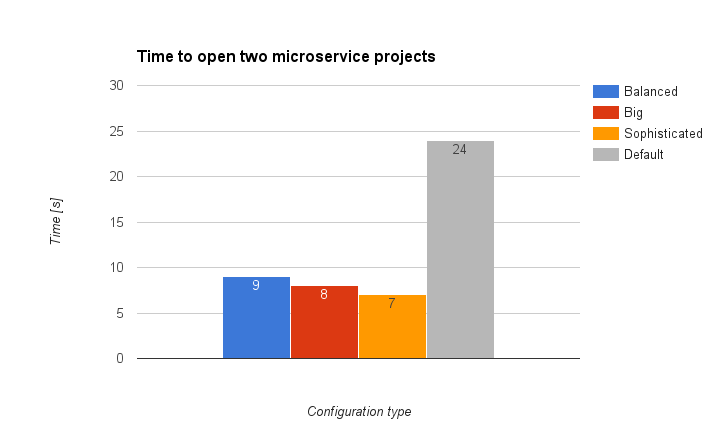
Ok, so we have our Monolith loaded but we need to add some code to two smaller microservices. So let’s open them in IDEA and compare total times.
In this test scenario we see that differences are still visible and Sophisticated wins here, Default is far behind the rest.
jstat -gcutil again
After loading two microservices we can check how Garbage Collectors is performing with three opened projects. We can see that three custom settings look almost the same and results of default settings are very, very poor.
Final stage: reload the Monolith
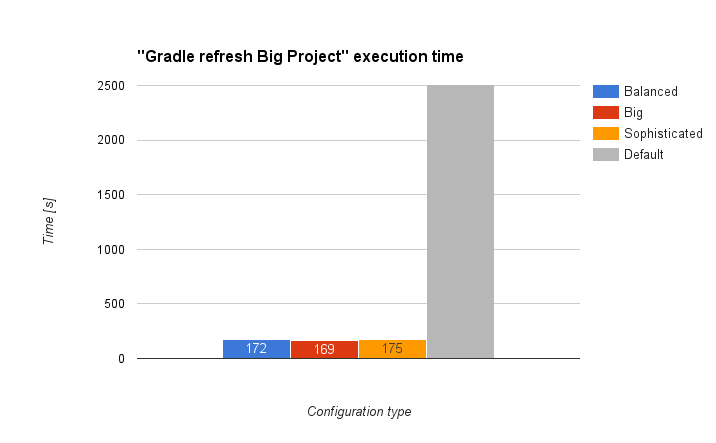
So we have coded for a while and now we need to fetch latest version of The Big Project from repository and then refresh Gradle Project so IDEA could see all new classes, etc.
Important note: Bar for Default setup is so high because IDEA crashed during refresh and I could not measure the actual time. Simply assigned memory was not sufficient to perform this operation.
But looking at the best three, we see that Big settings refreshed project in the shortest time so the largest assigned memory helps a bit here.
jstat -gcutil for the last time
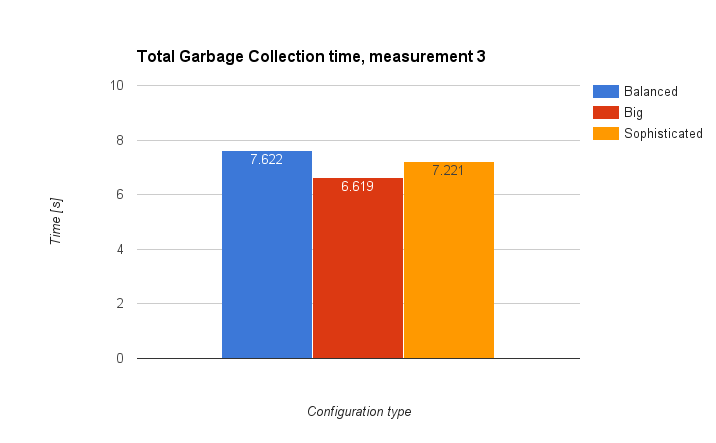
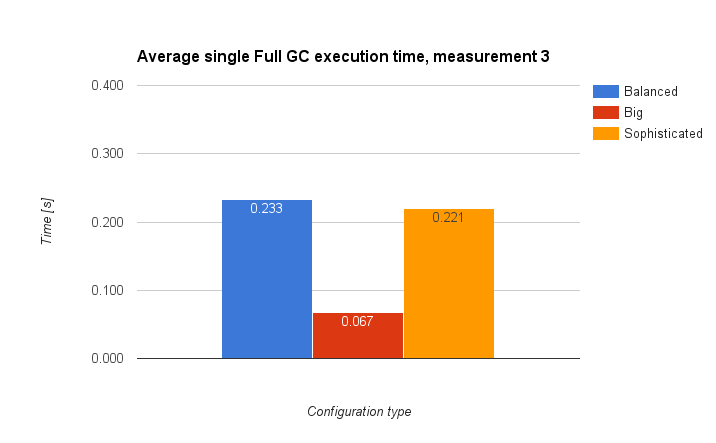
Because IDEA was not able to refresh projet with Default settings, they are not included in this measurement.
In these last charts we see that differences between total times are quite small, but single Full GC is the fastest with Big settings applied. Again, it looks like very large Xmx helps a bit more when it comes to responsiveness.
Summary
In this short experiment I tried to test how much we could gain by customising memory settings of IntelliJ IDEA and it looks like that even some simple tweaks can drastically improve performance of our IDE and speed up our work. Of course the more memory you assign, the better results you will see, but we are using IDE next to many different applications which also consume memory so our goal should be to find a balance between performance gain and memory consumption. I think that in most cases setting Xmx to value between 2g and 3g is the best approach. If you have some more time you can play with jstat and jvisualm to check how changing different VM flags affect performance and memory footprint.
And you?
And what about you? What is your idea.vmoptions setup? Do you have any other ways to improve InteliJ IDEA performance?
| Reference: | One and the Only One Reason to Customize IntelliJ IDEA Memory Settings from our JCG partner Tomasz Dziurko at the Code Hard Go Pro blog. |



There is a mistake in the balanced parameters: It should be -XX:+UseCompressedOops, not -XX:+:UseCompressedOops
Hello Bisu
You are absolutely right. I have fixed this typo in the original blog post soon after publication, but apparently my post was published at Java Code Geeks before my fix was applied.
Hello Tomasz, we’ve updated this post also. Thank you!
Which JVM were you using?