CLDB Monitoring Using JMX as a Modern Alternative to Ganglia
There are many options for monitoring the performance and health of a MapR cluster. In this post, I will present the lesser-known method for monitoring the CLDB using the Java Management Extensions (JMX).
According to one of the most highly regarded MapR Data Engineers, Akihiko Kusanagi, using JMX to get CLDB metrics can be seen as a more modern and simple way to access real-time performance metrics compared to using Ganglia. Ganglia has a long history serving as a metrics gathering service for distributed clusters and especially Hadoop, and its use in this role is well documented in the MapR docs.
Using JMX to monitor CLDB may be a savvy choice to avoid needing to install and configure third party monitoring solutions in the case of a cluster which doesn’t make use of such tools. Monitoring the CLDB at a fine level of detail in real time may be useful in very specific situations where the ordinary metrics collected about a production cluster aren’t giving all the details needed to resolve some issue with regards to the cluster’s health or performance. As we are talking abou the CLDB, this is especially true with regards to the health and performance of MapR-FS.
This post is intended primarily for experienced MapR cluster administrators and consultants. For the benefit of less experienced readers, I’ll still take a bit of time to go over a few basics before getting into the heart of the matter at hand.
CLDB Metrics
The CLDB (Container Location Database) is a MapR-specific technology at the heart of the MapR File System, and is a high-performance and reliable replacement for the Hadoop HDFS distributed file system.
The CLDB breaks the well-known single point of failure of other Hadoop distributions by replacing the NameNode. As such, the CLDB maintains information about the location of data in the cluster. Its reliability comes from running on usually three nodes of the cluster, with one serving as the master at any time.
Metrics are collected only by the CLDB master, as the other CLDB nodes are kept as slaves in read-only mode and thus collect no metrics.
A rather terse listing of the metrics collected can be found here in the MapR docs. The metrics are related the node’s hardware with CPU, memory, and network metrics, as well as MapR-FS specific metrics relating to volumes, containers, and RPC calls. Lastly, the service also collects cluster-wide, aggregate metrics for CPU, disk space, and memory.
Of particular interest are the CLDB master’s CPU load. In typical clusters of less than 100 nodes, the CLDB node also runs other services. As the cluster size increases, the CLDB node may become overworked, and very high CPU utilization may indicate a need to move to a CLDB-only node design, a best practice for very large clusters (link).
Java Management Extensions (JMX)
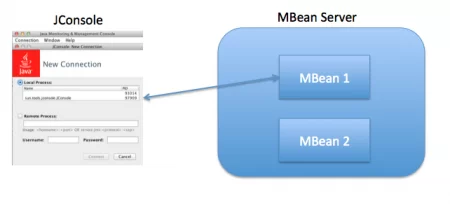
Introduced with the J2SE 5.0 JDK in 2004, JMX is meant for use in enterprise applications to make the system configurable or to get the state of application at any point in time. The CLDB service includes a running JMX server with an MBean registered.
Reading the CLDB application state in real time is possible using any of the numerous JMX console implementations. Here, I will focus on Jconsole, which is a standard tool part of Oracle’s JDK.
There are many online resources for learning more about JMX from Oracle’s excellent Java documentation and tutorial, as well as this tutorial from JournalDev.
Real-Time CLDB Monitoring with JConsole
In Mac OS and Linux, jconsole is installed automatically to /usr/local/bin and is thus available for use. The only dependency is Oracle’s JDK.
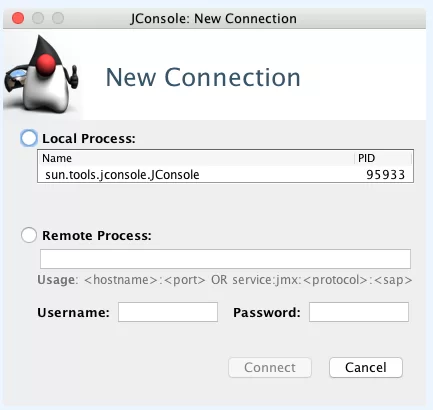
Executing jconsole starts a Java application with a login prompt:
To connect, select “Remote Process” and enter: <master CLDB host>:7220, then press “Connect”. The Username and Password fields can be left blank. A prompt will report failing to connect securely and offer to connect anyways or to cancel. Just select “Insecure Connection”.
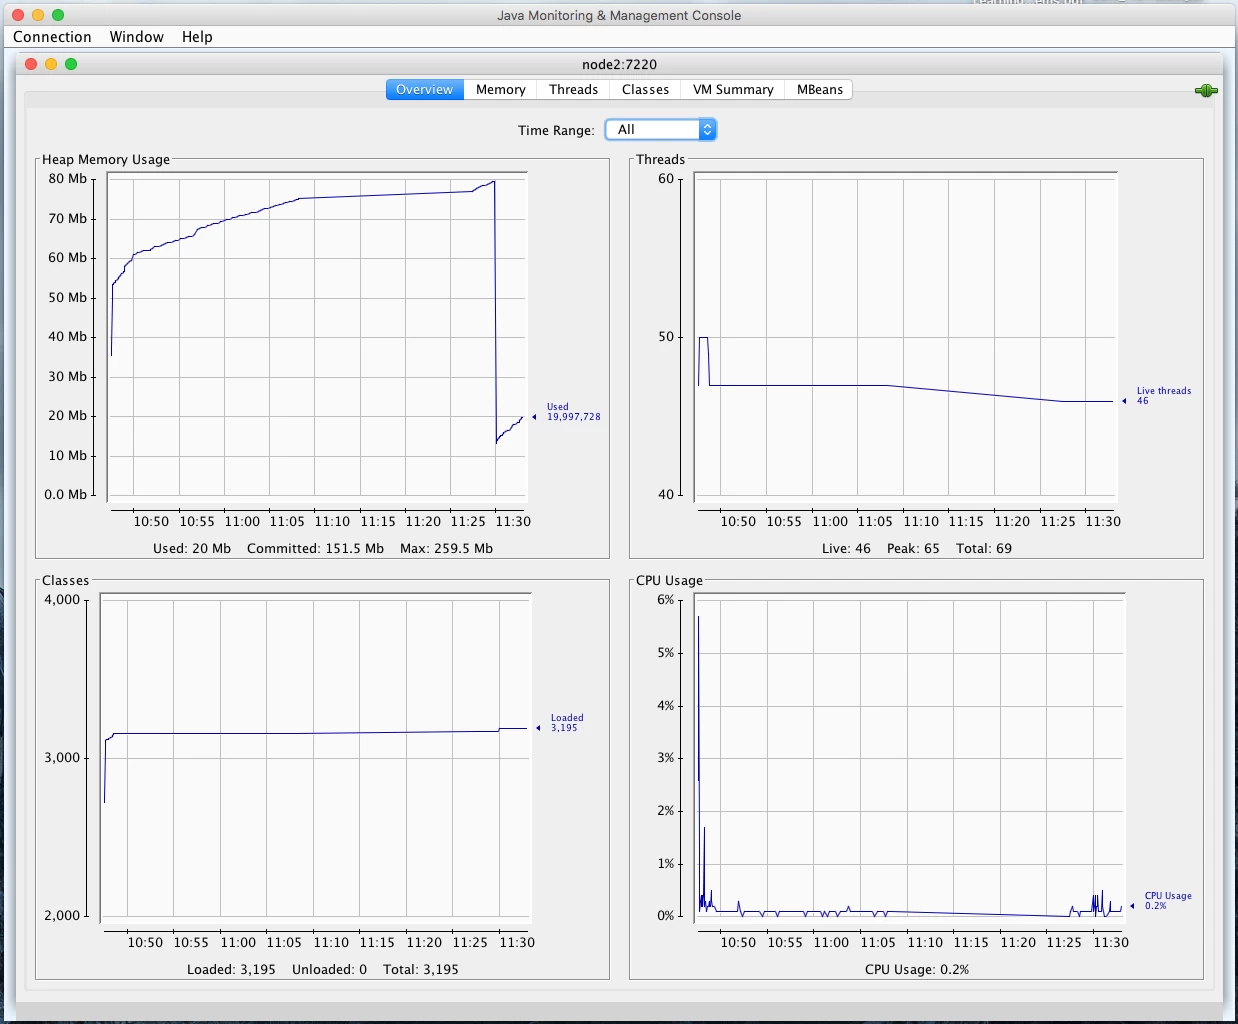
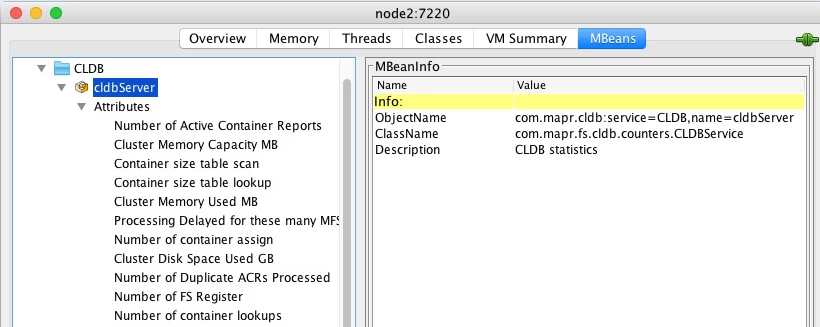
The JMX console opens by default to the “Overview” tab as shown above. It shows real- time metrics for memory and CPU. It’s a very “Java JVM monitoring view” with only the CPU chart of much practical use. All the action is in the MBeans tab and the “com.mapr.cldb” MBean.
This view allows access to all internal metrics collected by the master CLDB. The metrics collected go from the cluster level metrics such as “Cluster Memory Capacity” and “Disk Space Used” to extremely fine-grained metrics that may only be of interest to MapR internal Software Engineers (what is “Number of Duplicate ACR’s Processed”?).
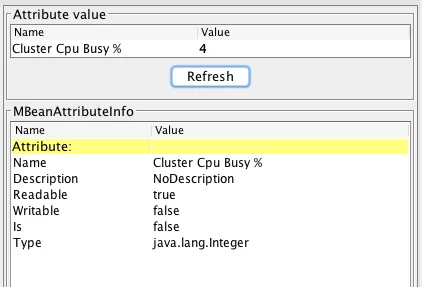
The metrics that MapR recommends are the ones exposed to Ganglia and listed in the documentation. What is inconvenient in this case is that there are no diagrams associated with the CLDB MBean. It is only possible to access values one at a time and the value is not refreshed automatically.
It is possible to access these numbers programmatically using Java of course, at some cost in time and effort. It is also possible to use Python (through the JPype1 package) by following the instructions in this blog post. Getting the metrics of interest programmatically took me only a few minutes using the information from that blog. From Python, it’s easy to forward the metrics on to a database, an ElasticSearch index, or even a flat file.
To be honest though, in practice, I would rather recommend using the MapR REST API for everyday monitoring needs of a production cluster, which will be the topic of another blog post.
Conclusion
Certainly, JMX monitoring of the CLDB is unlikely to be part of a MapR cluster admin’s everyday toolbox. But I found it interesting as a way to get a peek at the internal functioning of this critical part of MapR technology. Hopefully you will find it as interesting as I have.
| Reference: | CLDB Monitoring Using JMX as a Modern Alternative to Ganglia from our JCG partner Mathieu Dumoulin at the Mapr blog. |

