Java Performance Monitoring: 5 Open Source Tools You Should Know
Little known yet useful: The state of open source Application Performance Monitoring
One of the most important things for any application is performance. We want to make sure the users are getting the best experience they can, and to know that our app is up and running. That’s why most of us use at least one monitoring tool.
If you’re looking for something a little different in the performance monitoring market, one option you can choose is going for an open sourced tool. In the following post we’ve gathered some open source APM tools that are available today as an alternative to the paid tools, so you’ll be able to see if it’s the right choice for you.
Going Open Source
The APM market is a crowded one. You have big and well known names such as New Relic, AppDynamics (check out this post for an overview about them), along with Dynatrace (who we compared in previous posts), along with some smaller or lesser known tools. Since there are so many players in the game, and they all know the value of monitoring your application, they keep their code for themselves.
However, there’s an alternative in the market: open source tools. These tools present a good option if you’re interested in an easy way to gain visibility for you application in production, and if you want to know how your code is actually being monitored.
There are a few key APM tools in the open source community as well, each with its own offerings and possibilities. If you’re intrigued and want to know exactly what open source APM has in store for you, we’ve covered the top 5 tools available for you:
- Stagemonitor
- Pinpoint
- MoSKito
- Glowroot
- Kamon
1. Stagemonitor
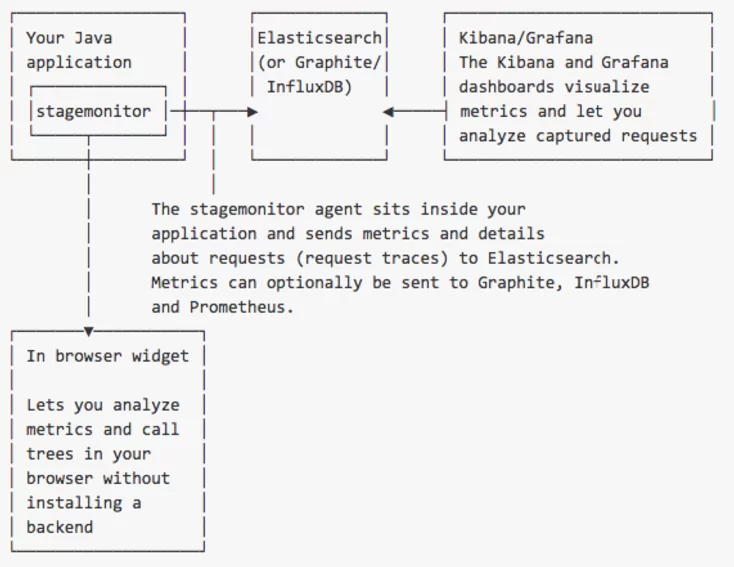
Stagemonitor offers a Java monitoring agent, that was built with clustered application stacks in mind. Meaning that it aims to monitor applications that are running on a number of servers. The tool integrates with time series databases (TSDB). This tool is optimized for handling time series data, along with arrays of numbers that are indexed by time. These databases include Elasticsearch, Graphite and InfluxDB.
Architecture
How does it work?
Stagemonitor includes an agent that sits in your Java application, sending metrics and request traces to the central database. The tool only requires one instance to monitor all applications, instances and hosts and can be deployed inside your own datacenter.
On the monitoring side, you can view historical or live data from the cluster, or directly from the developer server, create custom alerts and define thresholds for each metric.
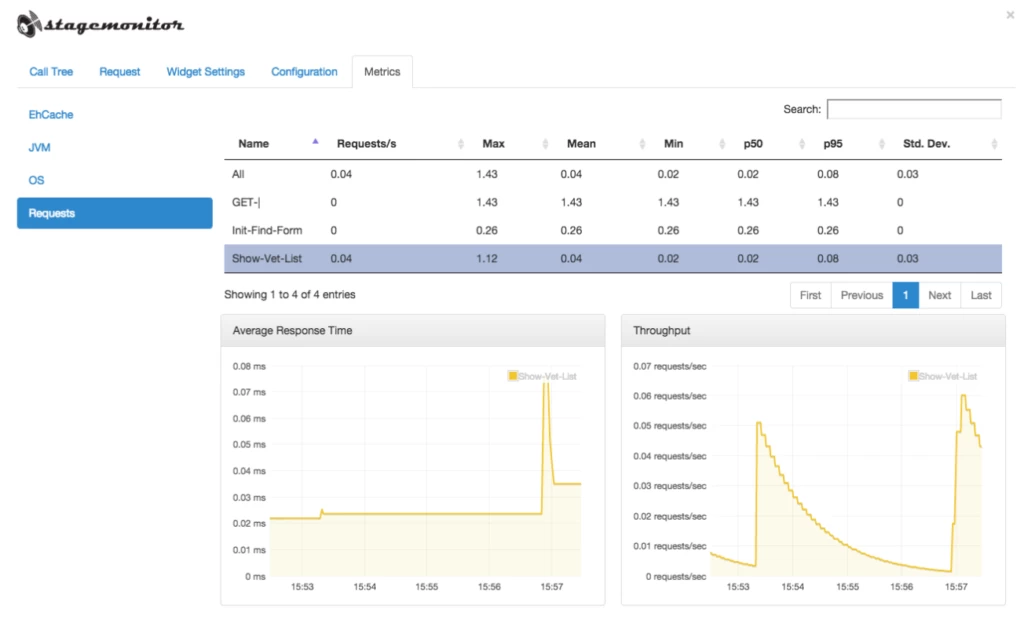
Stagemonitor includes a dashboard, so you can visualize and analyse the different metrics and requests you’re interested in. You can create custom dashboards, write your custom plugins or even use 3rd party plugins. It offers an in-browser widget with no backend required that is automatically injected to the monitored webpage. You can view the live demo in the following link.
In the official documentation, Stagemonitor states that it offers support for non servlet based applications as well, and you can check out the full requirements here.
Stagemonitor’s Widget Metrics
Bottom line: If you’re already familiar with the ELK stack, it’s definitely worth checking out for a quick test run.
2. Pinpoint
Pinpoint is an APM tool made for large scale distributed systems. It’s modelled after Dapper, a distributed systems tracing infrastructure built by Google, providing its developers more information about the behavior of complex distributed systems.
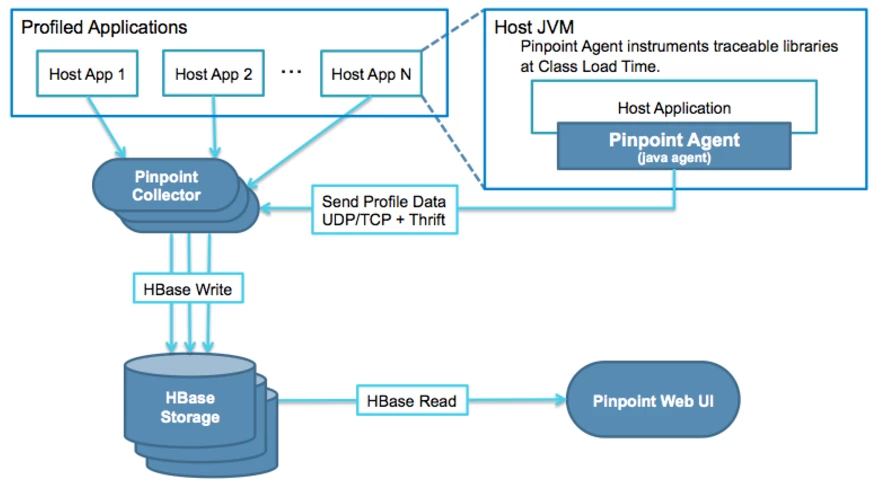
Architecture
How does it work?
The tool helps analyze the overall structure of the system and how components within them are interconnected, by tracing transactions across distributed applications. Meaning that it aims to explain how every transaction gets executed, trace the flows between the components and (bad joke ahead) pinpoints problem areas and potential bottlenecks.
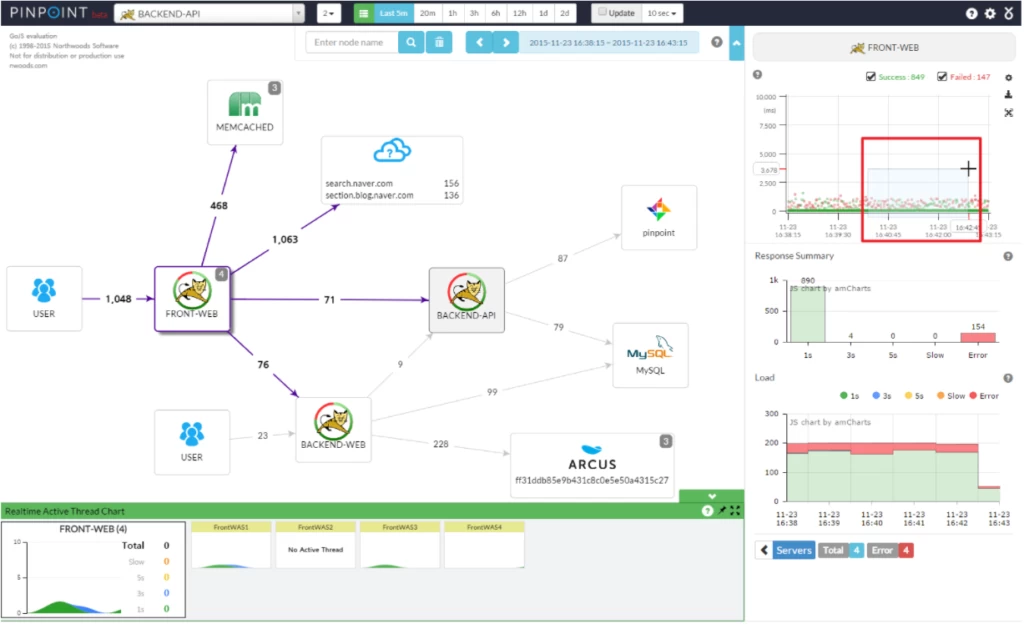
The dashboard helps visualize how the components are connected, and lets you monitor active threads inside the applications in real time. Pinpoint also lets you see the request count and response patterns so you’ll be able to identify potential problems. You can view critical details that include CPU usage, memory/garbage collection and JVM arguments.
Pinpoint works with an agent that’s installed without any code changes, and you can run a sample instance in your own machine by running four simple scripts for each of the components: Collector, Web, Sample TestApp and HBase.
Pinpoint’s ServerMap
Bottom line: If you’ve heard of Dapper, or would like to monitor and analyze your complex distributed systems, you should definitely check this tool out.
3. MoSKito
MoSKito offers 3 tools in one:
- MoSKito-Essential – The basic standalone project. It’s the core of MoSKito functionality that lets you monitor your application
- MoSKito-Central – Centralised storage server for keeping the performance data
- MoSKito-Control – A tool for monitoring performance of multi-node web applications
How does it work?
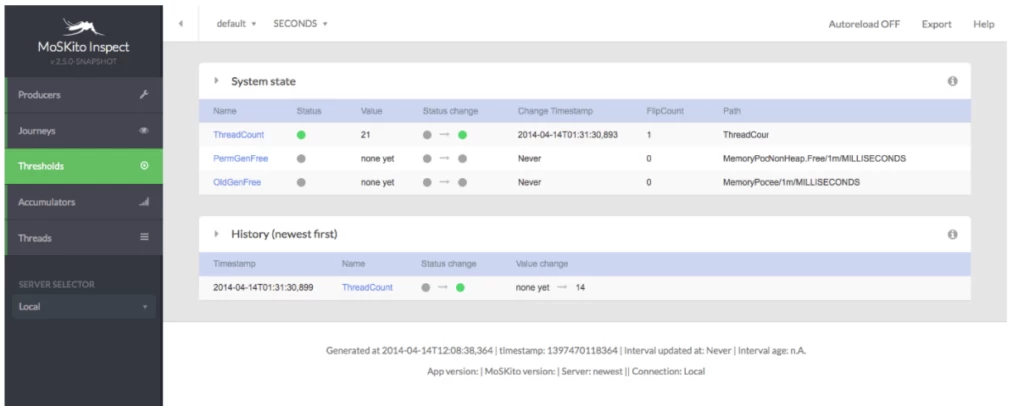
To get started, all you need to do is drop the .jar file into the WEB-INF/lib folder or by including a small new section in the web.xml file. Once the tool is up and running, it collects performance data, analyse it in real time as well as storing it for historical analysis.
The tool collects all of your performance metrics, such as threads, memory, caches, storages, services, registrations, payments, conversion, SQL, load distribution and so on. It doesn’t require code change, supports all of the major app servers (Tomcat, Jetty, JBoss, WebLogic) and keeps the data locally.
You also get a notification system to know when a threshold was met, and the recordings of user’s actions you want to monitor. Along with the web-based dashboards, the tool also offers a mobile app to monitor your application on the go.
MoSKito’s Essential
Bottom line: MoSKito first launched at 2007, and by now it’s a well known and stable tool, that’s supported by the team and by the community, including paid support options. That’s also a huge plus for any open source tool.
4. Glowroot
Glowroot prides itself on being a fast, clean and simple APM tool. It will allow tracing capture for slow requests and errors, and you’ll be able to log time trace for each user action, as well as SQL capture and aggregation. The tool also presents a historical rollup of all data with configurable retention.
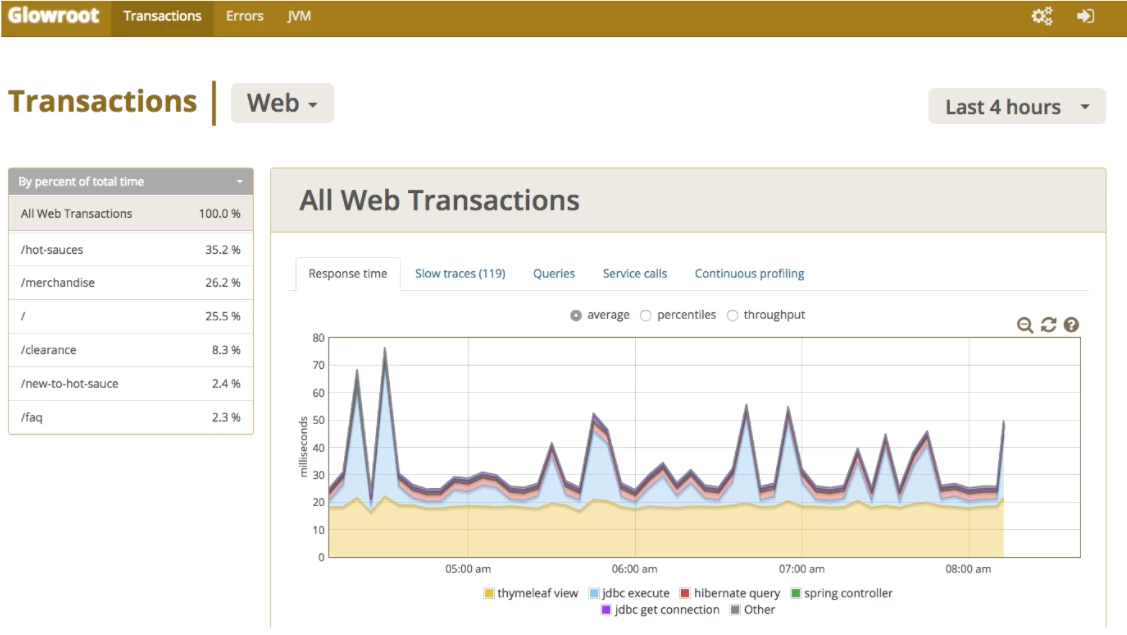
It provides charts to visualize response time breakdown and response time percentiles, and its responsive UI will allow you to monitor your application from your mobile devices as well as your desktop.
Architecture
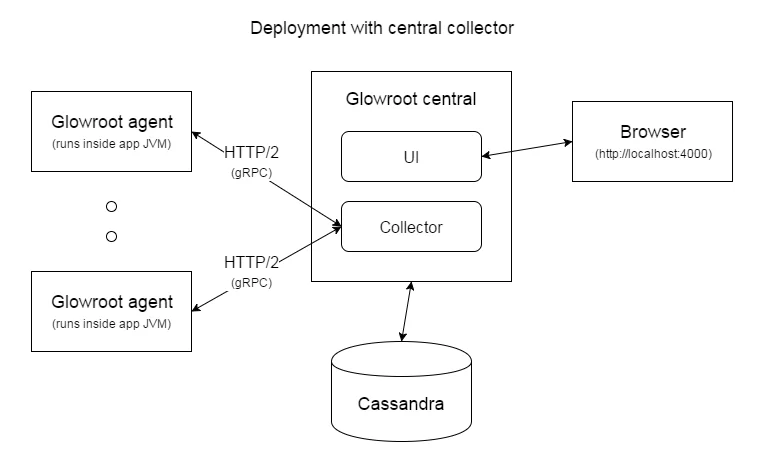
Glowroot architecture
How does it work?
To get started with Glowroot, you need to download and unzip the main installation file and add -javaagent:path/to/glowroot.jar to your application’s JVM arguments. After you start your application, all that’s left is pointing the browser to http://localhost:4000.
Once the tool is up and running, you’ll get continuous profiling (with filtering options), along with being able to set up alerts for response time percentiles and MBean attributes. Glowroot offers full support for async requests that span multiple threads, and it supports Tomcat, TomEE, JBoss EAP, Wildfly, Jetty and Glassfish.
Glowroot’s Dashboard
Bottom line: If clean and simple is what you’re looking for, no doubt you’d want to check out Glowroot over the other tools here.
5. Kamon
Kamon is a reactive-friendly toolkit that is built for applications that run on top of the JVM. More specifically, it’s made for applications that are built with the Typesafe Reactive Platform (using Scala, Akka, Spray and/or Play!), but still offers support for any other JVM platforms and languages.
Architecture
How does it work?
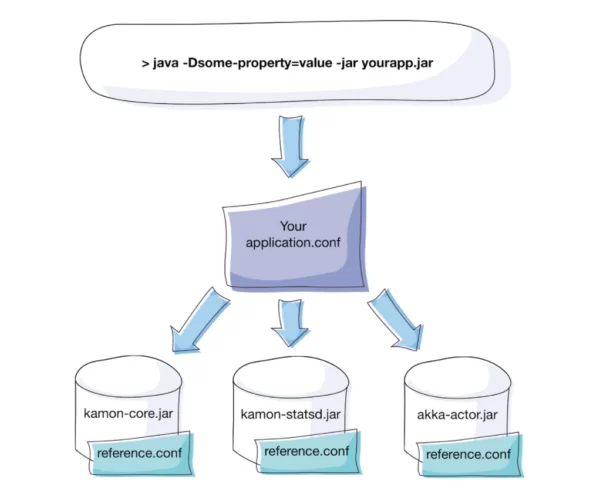
Kamon is distributed as a core module with all the metric recording and trace manipulation APIs and optional modules that provide bytecode instrumentation and/or reporting capabilities to your application. Or in other words, it offers a simple API for recording metrics and trace information for JVM applications.
All of Kamon’s modules are available through Maven Central, and you will need to add them as a compile dependency to your project. Once you’ve included the modules you’re interested in, simply start up Kamon, and all of the available modules will be automatically started, you don’t need to explicitly activate/start them.
The tracing modules will allow recording data about functionality executed in your application, and the metrics module will allow you to control the registration of entities being tracked either by user code or by instrumentation provided with other Kamon modules. It also has other abilities such as filtering, configuring instrument factories and dispatching metrics subscriptions.
Bottom line: If you’re using a number of JVM languages, or mostly Scala / Akka, and would like “one tool to monitor them all”, Kamon might be the friendliest choice to go for.
Now that you’ve got your haystack…
APM tools are great at giving you the information about whether your application is up and running, or if there’s something that’s holding it back. The only problem is that once you get that haystack in which the problem was found, you have to start digging around looking for the actual needle that caused it.
Instead of sifting through log files trying to locate what went wrong, where it happened and what might have cause it – there’s a better solution. OverOps will not only give you the answers to where and when, it will also show you why the error happened – giving you the complete source code and variable state that caused an error, across the entire call stack. Check it out.
Final thoughts
These are some good alternatives to the paid tools in the APM space. BUT… Some might think that going for the open source option is mostly a way to save a few bucks. It’s also important to remember that while you won’t need to issue an invoice for the use of the tool, it doesn’t necessarily mean it’s cheaper.
Open source tools come with a price: installation, troubleshooting and of course maintenance, which will all be done in house, by your very own engineers or even you. And not to mention the time you might end up wasting seeking support for a specific issue only you’ve encountered, and the community never heard of.
Our 2 cents is that open source can be great, but you should also keep the other costs in mind and only then reach a decision.
Any other open source APM tools you think we should check out? Tell us about them in the comments below!
| Reference: | Java Performance Monitoring: 5 Open Source Tools You Should Know from our JCG partner Henn Idan at the OverOps blog. |



Thanks for this overview of open source APM solutions, you can also take a look at “inspectIT” : https://inspectit-performance.atlassian.net/wiki
I would like to add one more to your list.
https://lorenzoongithub.github.io/nudge4j/
nudge4j is a monitoring tool for java 8 applications, which requires the simplest integration.