Visual Analytics + Open Source Deep Learning Frameworks
Deep Learning gets more and more traction. It basically focuses on one section of Machine Learning: Artificial Neural Networks. This article explains why Deep Learning is a game changer in analytics, when to use it, and how Visual Analytics allows business analysts to leverage the analytic models built by a (citizen) data scientist.
What is Deep Learning and Artificial Neural Networks?
Deep Learning is the modern buzzword for artificial neural networks, one of many concepts in machine learning to build analytics models. A neural network works similar to what we know from a human brain: You get non-linear interactions as input and transfer them to output. Neural networks leverage continuous learning and increasing knowledge in computational nodes between input and output. A neural network is a supervised algorithm in most cases, which uses historical data sets to learn parameters to predict outputs of future events, e.g. for cross selling or fraud detection. Unsupervised neural networks can be used to find new patterns and anomalies. In some cases, it makes sense to combine supervised and unsupervised algorithms.
Neural Networks are used in research for many decades and includes various sophisticated concepts like Recurrent Neural Network (RNN), Convolutional Neural Network (CNN), and Autoencoder. However, today’s powerful and elastic computing infrastructure in combination with other technologies like graphical processing units (GPU) with thousands of cores allows to do much more powerful computations with a much deeper number of layers. Hence the term “Deep Learning”.
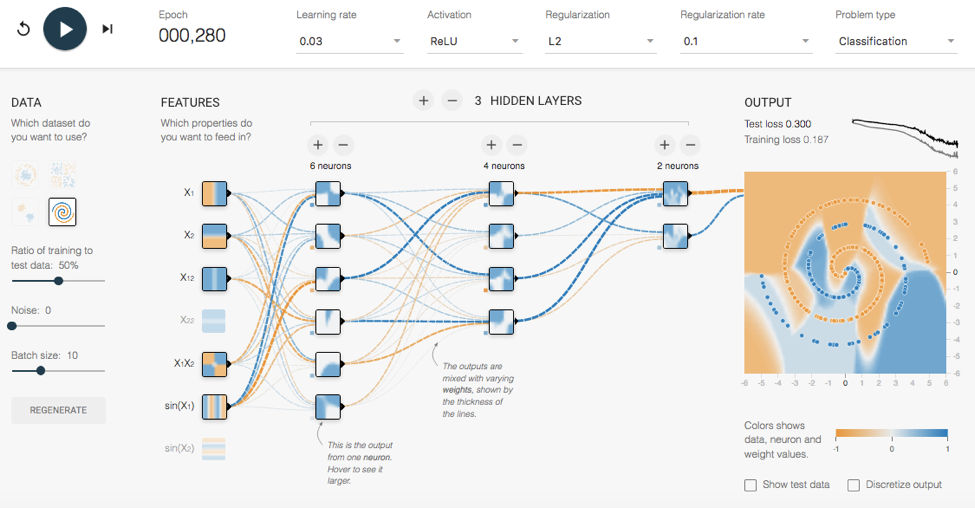
The following picture from TensorFlow Playground shows an easy-to-use environment which includes various test data sets, configuration options and visualizations to learn and understand deep learning and neural networks:
If you want to learn more about the details of Deep Learning and Neural Networks, I recommend the following sources:
- “The Anatomy of Deep Learning Frameworks” – an article about the basic concepts and components of neural networks
- TensorFlow Playground to play around with neural networks by yourself hands-on without any coding, also available on Github to build your own customized offline playground
- “Deep Learning Simplified” video series on Youtube with several short, simple explanations of basic concepts, alternative algorithms and some frameworks like H2O.ai or Tensorflow
While Deep Learning is getting more and more traction, it is not the silver bullet for every scenario.
When (not) to use Deep Learning?
Deep Learning enables many new possibilities which were not possible in “mass production” a few years ago, e.g. image classification, object recognition, speech translation or natural language processing (NLP) in much more sophisticated ways than without Deep Learning. A key benefit is the automated feature engineering, which costs a lot of time and efforts with most other machine learning alternatives.
You can also leverage Deep Learning to make better decisions, increase revenue or reduce risk for existing (“already solved”) problems instead of using other machine learning algorithms. Examples include risk calculation, fraud detection, cross selling and predictive maintenance.
However, note that Deep Learning has a few important drawbacks:
- Very expensive, i.e. slow and compute-intensive; training a deep learning model often takes days or weeks, execution also takes more time than most other algorithms.
- Hard to interpret: lack of understandability of the result of the analytic model; often a key requirement for legal or compliance regularities
- Tends to overfit, and therefore needs regularization
Deep Learning is ideal for complex problems. It can also outperform other algorithms in moderate problems. Deep Learning should not be used for simple problems. Other algorithms like logistic regression or decision trees can solve these problems easier and faster.
Open Source Deep Learning Frameworks
Neural networks are mostly adopted using one of various open source implementations. Various mature deep learning frameworks are available for different programming languages.
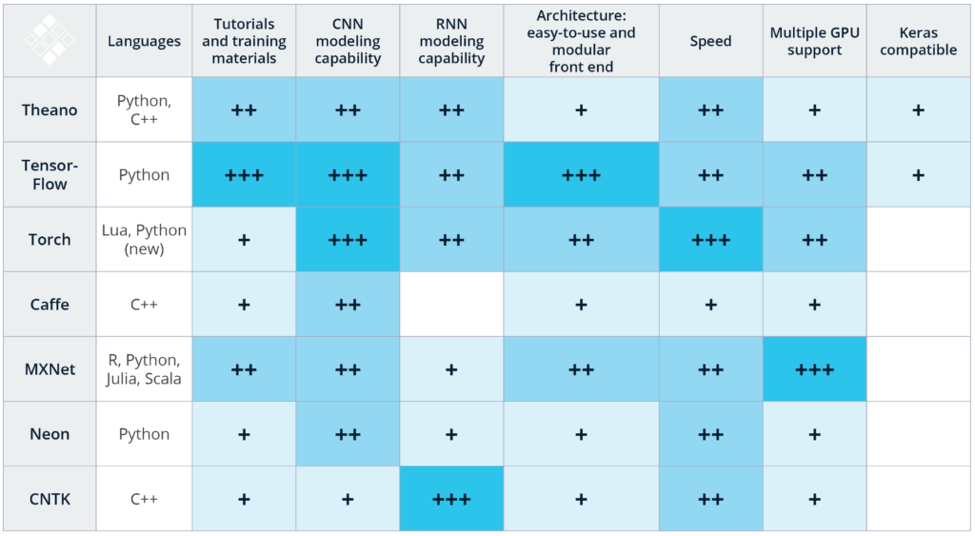
The following picture shows an overview of open source deep learning frameworks and evaluates several characteristics:
These frameworks have in common that they are built for data scientists, i.e. personas with experience in programming, statistics, mathematics and machine learning. Note that writing the source code is not a big task. Typically, only a few lines of codes are needed to build an analytic model. This is completely different from other development tasks like building a web application, where you write hundreds or thousands of lines of code. In Deep Learning – and Data Science in general – it is most important to understand the concepts behind the code to build a good analytic model.
Some nice open source tools like KNIME or RapidMiner allow visual coding to speed up development and also encourage citizen data scientists (i.e. people with less experience) to learn the concepts and build deep networks. These tools use own deep learning implementations or other open source libraries like H2O.ai or DeepLearning4j as embedded framework under the hood.
If you do not want to build your own model or leverage existing pre-trained models for common deep learning tasks, you might also take a look at the offerings from the big cloud providers, e.g. AWS Polly for Text-to-Speech translation, Google Vision API for Image Content Analysis, or Microsoft’s Bot Framework to build chat bots. The tech giants have years of experience with analysing text, speech, pictures and videos and offer their experience in sophisticated analytic models as a cloud service; pay-as-you-go. You can also improve these existing models with your own data, e.g. train and improve a generic picture recognition model with pictures of your specific industry or scenario.
Deep Learning in Conjunction with Visual Analytics
No matter if you want to use “just” a framework in your favourite programming language or a visual coding tool: You need to be able to make decisions based on the built neural network. This is where visual analytics comes into play. In short, visual analytics allows any persona to make data-driven decisions instead of listening to gut feeling when analysing complex data sets. See “Using Visual Analytics for Better Decisions – An Online Guide” to understand the key benefits in more detail.
A business analyst does not understand anything about deep learning, but just leverages the integrated analytic model to answer its business questions. The analytic model is applied under the hood when the business analyst changes some parameters, features or data sets. Though, visual analytics should also be used by the (citizen) data scientist to build the neural network. See “How to Avoid the Anti-Pattern in Analytics: Three Keys for Machine Learning” to understand in more details how technical and non-technical people should work together using visual analytics to build neural networks, which help solving business problems. Even some parts of data preparation are best done within visual analytics tooling as describe in “Data Preprocessing vs. Data Wrangling in Machine Learning Projects”.
From a technical perspective, Deep Learning frameworks (and in a similar way any other Machine Learning frameworks, of course) can be integrated into visual analytics tooling in different ways. The following list includes a TIBCO Spotfire example for each alternative:
- Embedded Analytics: Implemented directly within the analytics tool (self-implementation or “OEM”); can be used by the business analyst without any knowledge about machine learning (Spotfire: Clustering via some basic, simple configuration of an input and output data plus cluster size)
- Native Integration: Connectors to directly access external deep learning clusters. (Spotfire: TERR to use R’s machine learning libraries, KNIME connector to directly integrate with external tooling)
- Framework API: Access via a Wrapper API in different programming languages. For example, you could integrate MXNet via R or TensorFlow via Python into your visual analytics tooling. This option can always be used and is appropriate if no native integration or connector is available. (Spotfire: MXNet’s R interface via Spotfire’s TERR Integration for using any R library)
- Integrated as Service via an Analytics Server: Connect external deep learning clusters indirectly via a server-side component of the analytics tool; different frameworks can be accessed by the analytics tool in a similar fashion (Spotfire: Statistics Server for external analytics tools like SAS or Matlab)
- Cloud Service: Access pre-trained models for common deep learning specific tasks like image recognition, voice recognition or text processing. Not appropriate for very specific, individual business problems of an enterprise. (Spotfire: Call public deep learning services like image recognition, speech translation, or Chat Bot from AWS, Azure, IBM, Google via REST service through Spotfire’s TERR / R interface)
All options have in common that you need to add configuration of some hyper-parameters, i.e. “high level” parameters like problem type, feature selection or regularization level. Depending on the integration option, this can be very technical and low level, or simplified and less flexible using terms which the business analyst understands.
Deep Learning Example: Autoencoder Template for TIBCO Spotfire
Let’s take one specific category of neural networks as example: Autoencoders to find anomalies. Autoencoder is an unsupervised neural network used to replicate the input dataset by restricting the number of hidden layers in a neural network. A reconstruction error is generated upon prediction. The higher the reconstruction error, the higher is the possibility of that data point being an anomaly.
Use Cases for Autoencoders include fighting financial crime, monitoring equipment sensors, healthcare claims fraud, or detecting manufacturing defects. A generic TIBCO Spotfire template is available in the TIBCO Community for free. You can simply add your data set and leverage the template to find anomalies using Autoencoders – without any complex configuration or even coding. Under the hood, the template uses H2O.ai’s deep learning implementation and its R API. It runs in a local instance on the machine where to run Spotfire. You can also take a look at the R code, but this is not needed to use the template at all and therefore optional.
Real World Example: Anomaly Detection for Predictive Maintenance
Let’s use the Autoencoder for a real-world example. In telco, you have to analyse the infrastructure continuously to find problems and issues within the network. Best before the failure happens so that you can fix it before the customer even notices the problem. Take a look at the following picture, which shows historical data of a telco network:
The orange dots are spikes which occur as first indication of a technical problem in the infrastructure. The red dots show a constant failure where mechanics have to replace parts of the network because it does not work anymore.
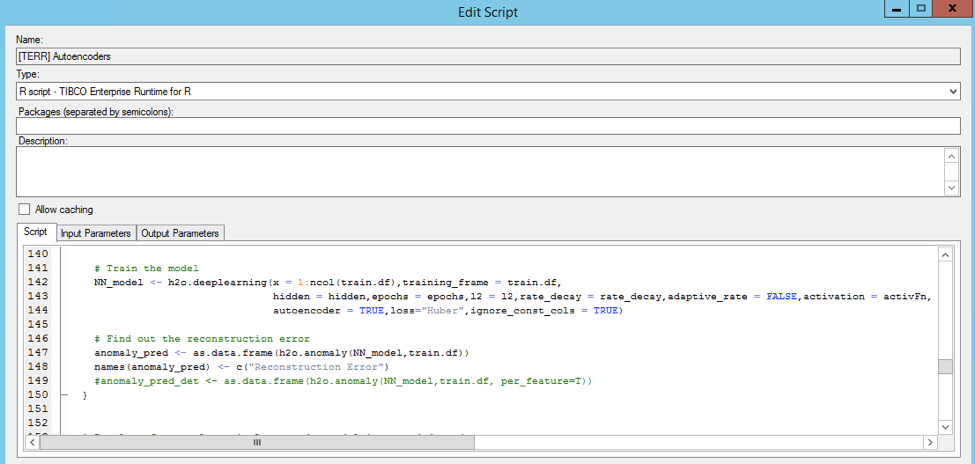
Autoencoders can be used to detect network issues before they actually happen. TIBCO Spotfire is uses H2O’s Autoencoder in the background to find the anomalies. As discussed before, the source code is relative scarce. Here is the snipped of building the analytic model with H2O’s Deep Learning R API and detecting the anomalies (by finding out the reconstruction error of the Autoencoder):
This analytic model – built by the data scientist – is integrated into TIBCO Spotfire. The business analyst is able to visually analyse the historical data and the insights of the Autoencoder. This combination allows data scientists and business analysts to work together fluently. It was never easier to implement predictive maintenance and create huge business value by reducing risk and costs.
Apply Analytic Models to Real Time Processing with Streaming Analytics
This article focuses on building deep learning models with Data Science Frameworks and Visual Analytics. Key for success in projects is to apply the build analytic model to new events in real time to add business value like increasing revenue, reducing cost or reducing risk.
“How to Apply Machine Learning to Event Processing” describes in more detail how to apply analytic models to real time processing. Or watch the corresponding video recording leveraging TIBCO StreamBase to apply some H2O models in real time. Finally, I can recommend to learn about various streaming analytics frameworks to apply analytic models.
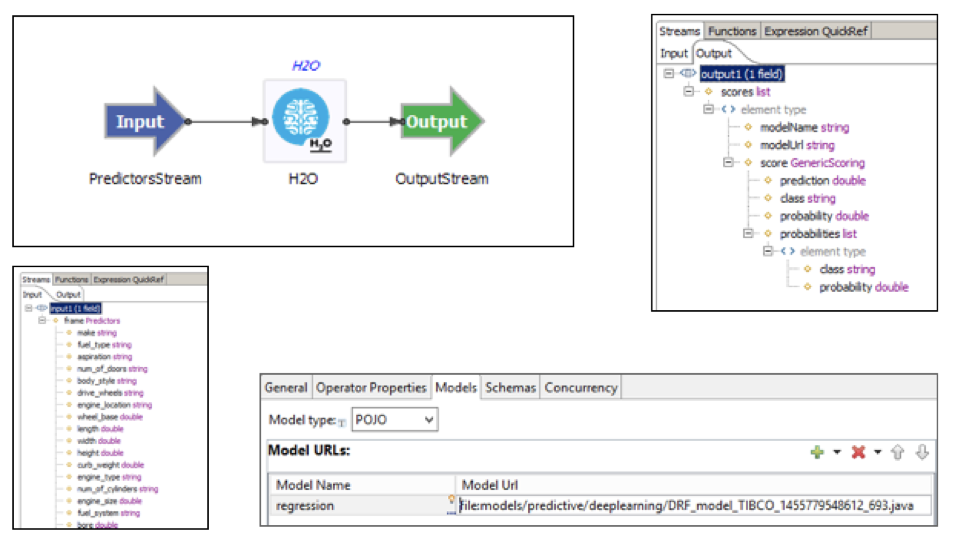
Let’s come back to the Autoencoder use case to realize predictive maintenance in telcos. In TIBCO StreamBase, you can easily apply the built H2O Autoencoder model without any redevelopment via StreamBase’ H2O connector. You just attach the Java code generated by H2O framework, which contains the analytic model and compiles to very performant JVM bytecode:
The most important lesson learned: Think about the execution requirements before building the analytic model. What performance do you need regarding latency? How many events do you need to process per minute, second or millisecond? Do you need to distribute the analytic model to a clusters with many nodes? How often do you have to improve and redeploy the analytic model? You need to answer these questions at the beginning of your project to avoid double efforts and redevelopment of analytic models!
Another important fact is that analytic models do not always need score very fast or frequently (like if you want to score every single event in a sensor analytics use case). In the above telco infrastructure example, these spikes and failures might happen in subsequent days or even weeks. Thus, in many use cases, it is fine to score an analytic model once an hour or even once a day.
Deep Learning + Visual Analytics + Streaming Analytics = Next Generation Big Data Success Stories
Deep Learning allows to solve many well understood problems like cross selling, fraud detection or predictive maintenance in a more efficient way. In addition, you can solve additional scenarios, which were not possible to solve before, like accurate and efficient object detection or speech-to-text translation.
Visual Analytics is a key component in Deep Learning projects to be successful. It eases the development of deep neural networks by (citizen) data scientists and allows business analysts to leverage these analytic models to find new insights and patterns.
Today, (citizen) data scientists use programming languages like R or Python, deep learning frameworks like Theano, TensorFlow, MXNet or H2O’s Deep Water and a visual analytics tool like TIBCO Spotfire to build deep neural networks. The analytic model is embedded into a view for the business analyst to leverage it without knowing the technology details.
In the future, visual analytics tools might embed neural network features like they already embed other machine learning features like clustering or logistic regression today. This will allow business analysts to leverage Deep Learning without the help of a data scientist and be appropriate for simpler use cases.
However, do not forget that building an analytic model to find insights is just the first part of a project. Deploying it to real time afterwards is as important as second step. Good integration between tooling for finding insights and applying insights to new events can improve time-to-market and model quality in data science projects significantly. The development lifecycle is a continuous closed loop. The analytic model needs to be validated and rebuild in certain sequences.
| Reference: | Visual Analytics + Open Source Deep Learning Frameworks from our JCG partner Kai Waehner at the Blog about Java EE / SOA / Cloud Computing blog. |

