The Libraries and Packages of the Code Coverage Ecosystem
If you’ve been writing test-driven code for even a little while, you’ll know about code coverage (also known as test coverage). If you’re not familiar with the term, here are two short definitions. Wikipedia defines it as:
A measure used to describe the degree to which the source code of a program is executed when a particular test suite runs.
According to Martin Fowler, code coverage…
…helps you find which bits of your code aren’t being tested. It’s worth running coverage tools every so often and looking at these bits of untested code.
If you’re not already familiar with and making use of code coverage as part of your testing process or continuous development pipeline, I strongly encourage you to learn about it. With that said, today I’m going to kick off a two-part series, looking at code coverage tools.
Here in part one, I’ll step through tools for five of the most popular software development languages available today; these are PHP, Python, Go, Java, and Ruby.
In part two, I’ll step through four online services, covering the functionality that they provide, an overview of how they work, along with some differences in their respective approaches.
To make the tool coverage somewhat meaningful, I’ve created a small repository for each language that contains a modest user entity and an accompanying test suite for that entity in each of the five languages. That way, the test output that you’ll see should make more sense. I want to stress, the code isn’t going to change the world, but it’s enough to get a basic feel for each tool.
Here’s a quick link to each of the five repositories:
PHP
I’ll start off with PHP, as it’s the language that I spend the most time developing with at the moment. If you’ve spent any time around PHP, you’ll know that the candidate for providing code coverage is PHPUnit.
It’s PHP’s veteran testing framework that’s been around for quite some time. PHPUnit provides code coverage support via its PHP_CodeCoverage component, with makes use of PHP’s XDebug extension. Code coverage reports can be generated as HTML and XML files, and the report formats supported are Clover, Crap4J, and PHPUnit.
The reports themselves support the following metrics:
- Line, Function and Method, Class and Trait, Opcode, Branch, and Path coverage
- The Change Risk Anti-Patterns (CRAP) Index
is calculated based on the cyclomatic complexity and code coverage of a unit of code. Code that is not too complex and has an adequate test coverage will have a low CRAP index. The CRAP index can be lowered by writing tests and refactoring the code to lower its complexity.
Also, with the help of docblock annotations, PHPUnit supports the ability to ignore specific code blocks, such as those that aren’t able to be tested or ones that you want to ignore from code coverage analysis.
For example, you can use the @codeCoverageIgnore annotation to indicate that classes, functions, or lines should be ignored. Also, you can use the @codeCoverageIgnoreStart and @codeCoverageIgnoreEnd to ignore a segment of code.
You can also use the annotations to indicate that functions relate to one or several methods.
For example, let’s say that we had another method in the PHP User entity called getUserDetails, which returned all the User’s details. Naturally, their name is going to be part of their details. Given that, getName relates to that method. So we could add the annotation @covers User::getUserDetails to show that testing getName is involved in testing getUserDetails.
So you can see that code coverage in PHP is quite extensive and gives you a precise indication of what is and what is not covered by tests.
Running reports
Assuming that PHPUnit is available as a project dependency and the XDebug extension is installed, a code coverage report can be generated in one of two ways.
- Options can be passed to the invocation of PHPUnit on the command line, such as by running:
phpunit --coverage-html tests/coverage
- PHPUnit’s configuration file, phpunit.xml.dist, can be configured, in the logging section, to specify the necessary options, as in the following example:
<logging>
    <log type="coverage-html" target="test/coverage/report" lowUpperBound="35"
         highLowerBound="70"/>
    <log type="coverage-clover" target="/tmp/coverage.xml"/>
    <log type="coverage-php" target="test/coverage/coverage.serialized"/>
    <log type="coverage-text" target="php://stdout" showUncoveredFiles="false"/>
    <log type="junit" target="test/coverage/logfile.xml" logIncompleteSkipped="false"/>
    <log type="testdox-html" target="test/coverage/testdox.html"/>
    <log type="testdox-text" target="test/coverage/testdox.txt"/>
</logging>
Example reports
In the image below, you can see an example of the HTML report. At the top, you can see a tabular report, which shows the available coverage metrics for the file (or folder) in question; in this case, SimpleEntities/src/User.php.
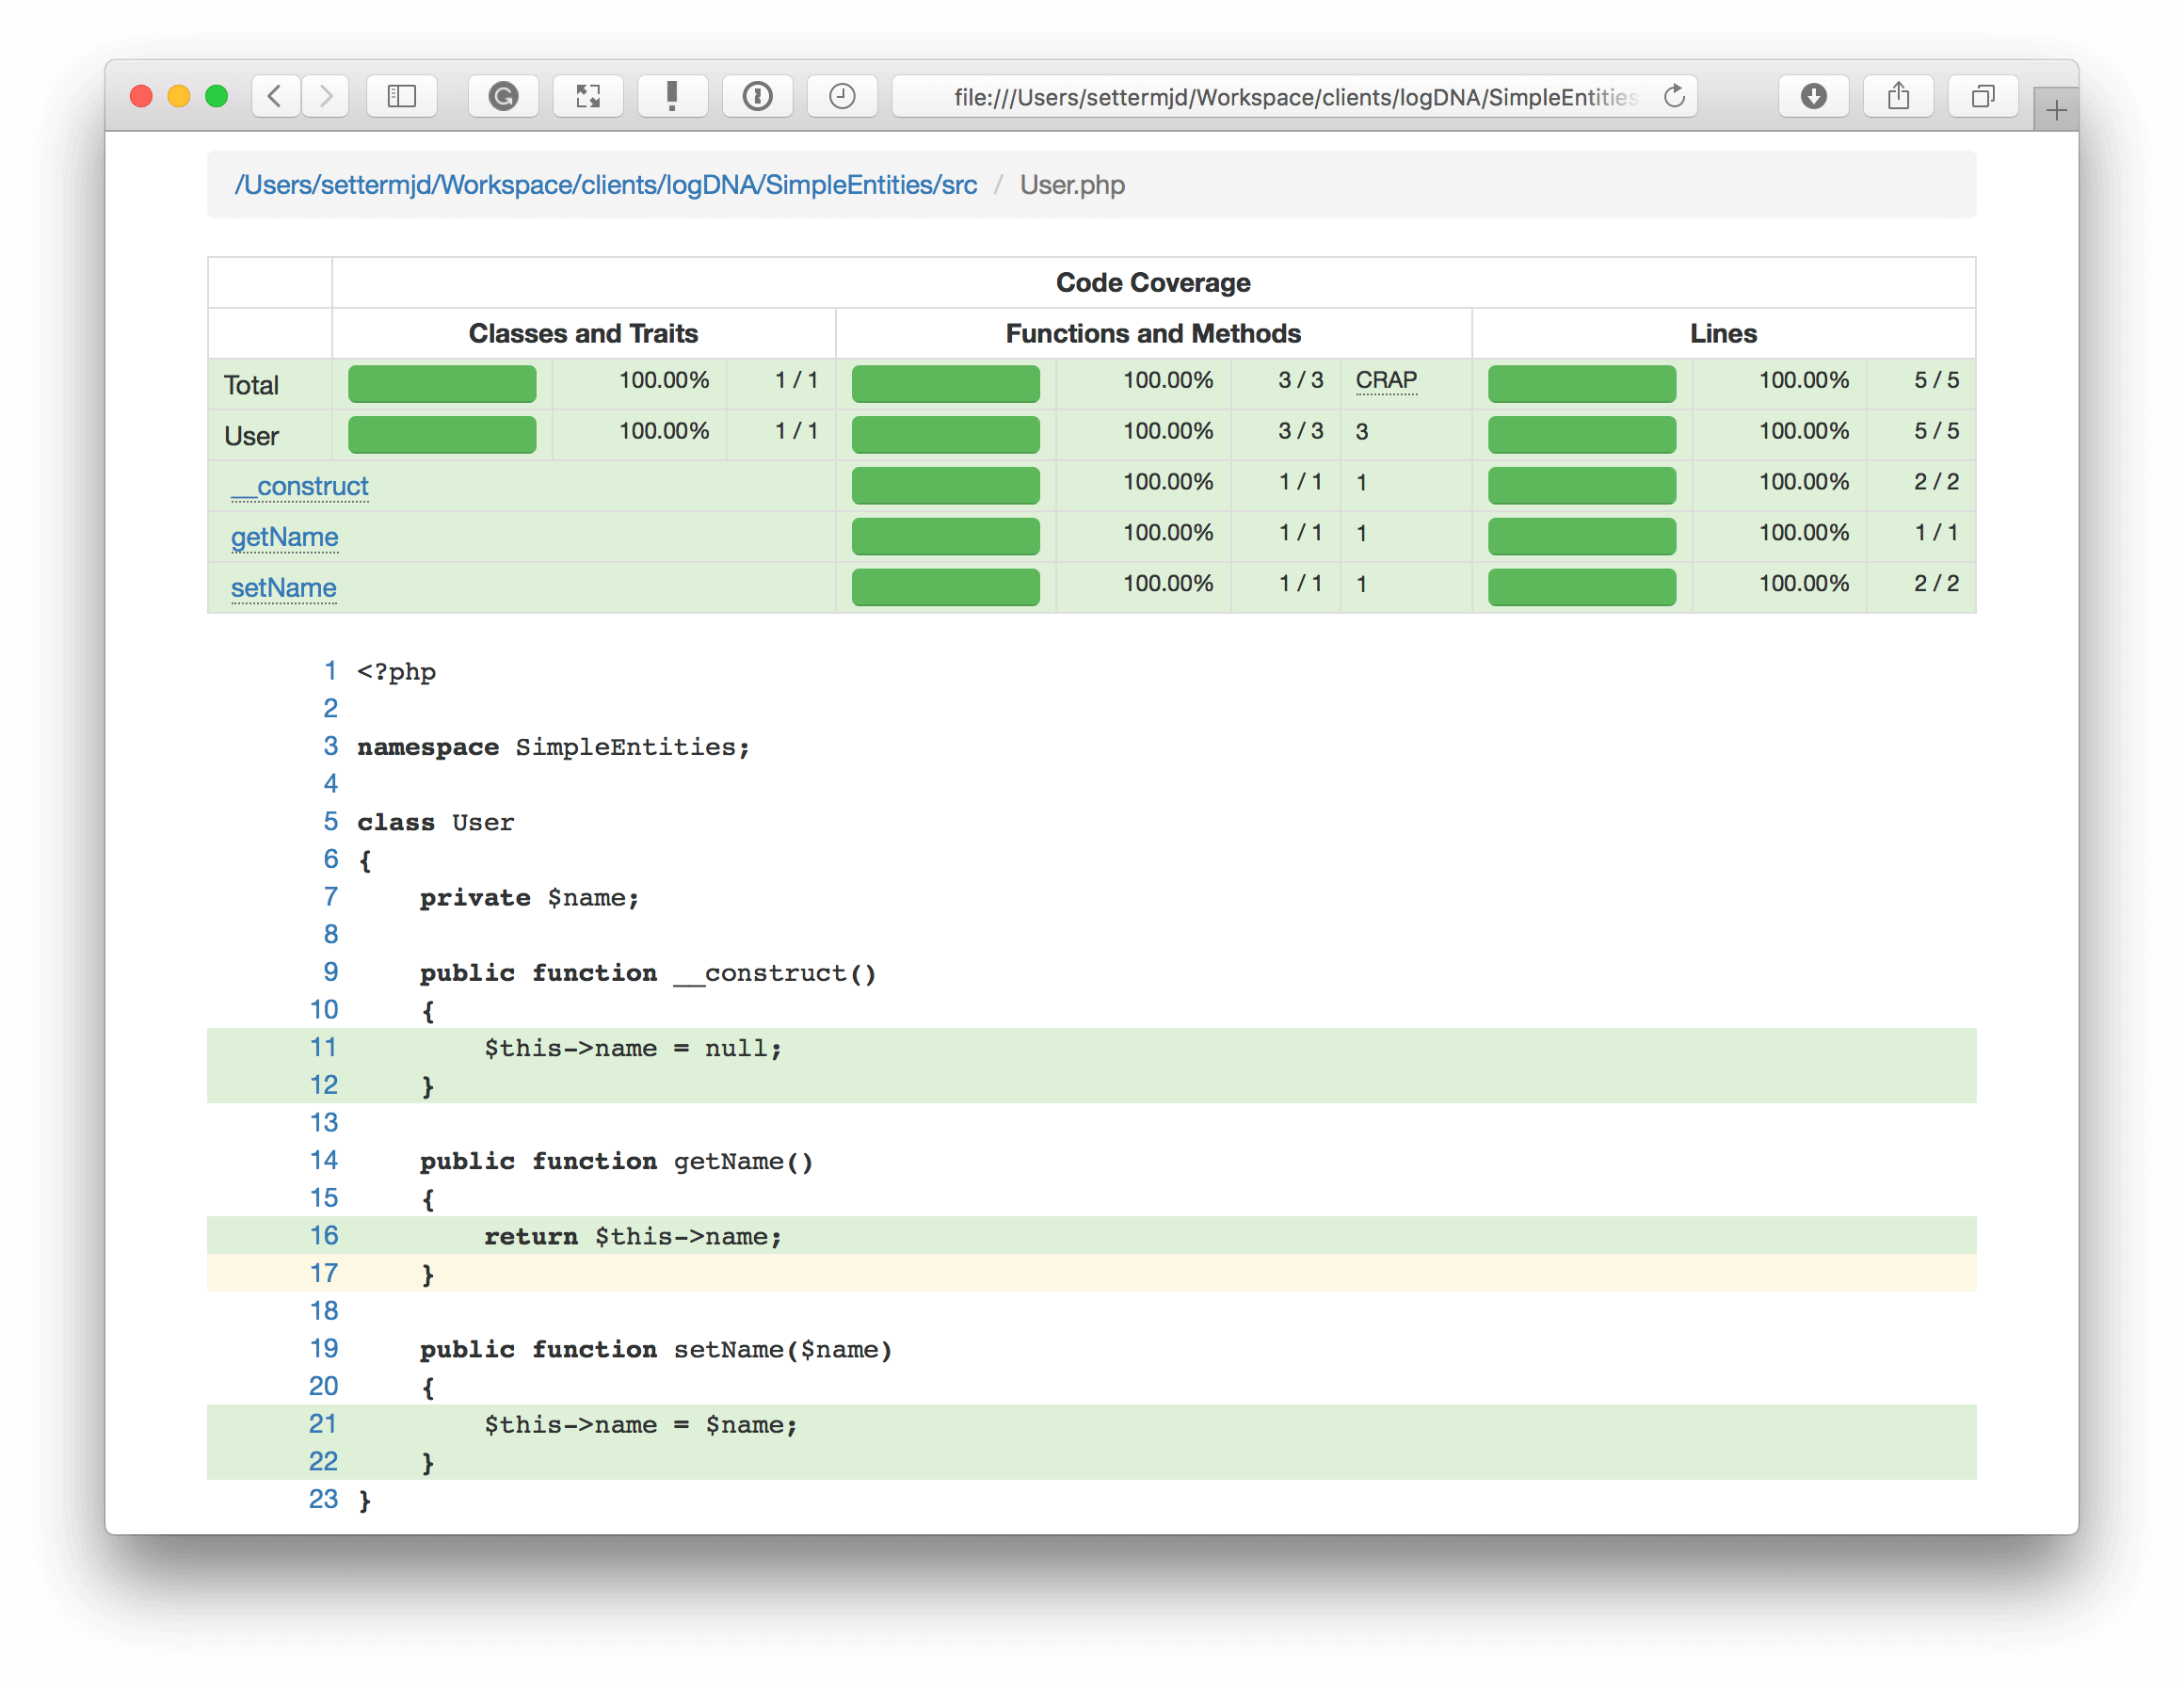
You can see that it has coverage of classes, traits, functions, methods, and lines. You can see that the class constructor and two methods — setName and getName — have 100 percent coverage.
As a further level of validation, underneath the tabular report, you can see the code highlighted. All but one line is in green, which means that line of code execution was tested. Yellow means a dead line of code. Also, there’s red, which indicates that line was not tested.
Python
For generating code coverage reports in Python, you can use several of Python’s testing libraries, in conjunction with Coverage.py.
Paraphrasing the documentation just a little, Coverage.py starts off by running one or more code files to learn what lines are executed in the code. During this phase, it runs a trace function that records each file and line number as it executes.
When execution finishes, it examines the executed code to determine what lines could have run. After these two steps have completed, based on the information retrieved, it produces a report that visualizes what was run and what wasn’t.
Like many Python libraries, it can be installed using a package manager, if you are using a Linux distribution, or via pip. Similar to most of the other libraries, Coverage.py can generate reports in both HTML and XML file formats.
As it uses a trace function to extract the information for generating a report, using it with any other testing library is quite straightforward.
Installation and running reports
In the example repository, I’ve used Python’s UnitTest library to create a simple set of unit tests. To run the test suite, I would use the command python setup.py test.
To generate a code coverage report, first you would have to call coverage run and pass to it the python code that you want to analyze. To do that, I would run coverage run setup.py test, which would get Coverage.py to execute and analyze my test suite. After that, coverage information would be available, so I could now run coverage report, which prints the coverage report out to STDOUT.
Here’s an example of what that would look like:
[simple-entity] coverage report
Name                          Stmts   Miss  Cover
-------------------------------------------------
entities/__init__.py              0      0   100%
entities/tests/__init__.py        0      0   100%
entities/tests/test_user.py      12      1    92%
entities/user.py                  9      0   100%
-------------------------------------------------
TOTAL                            21      1    95%
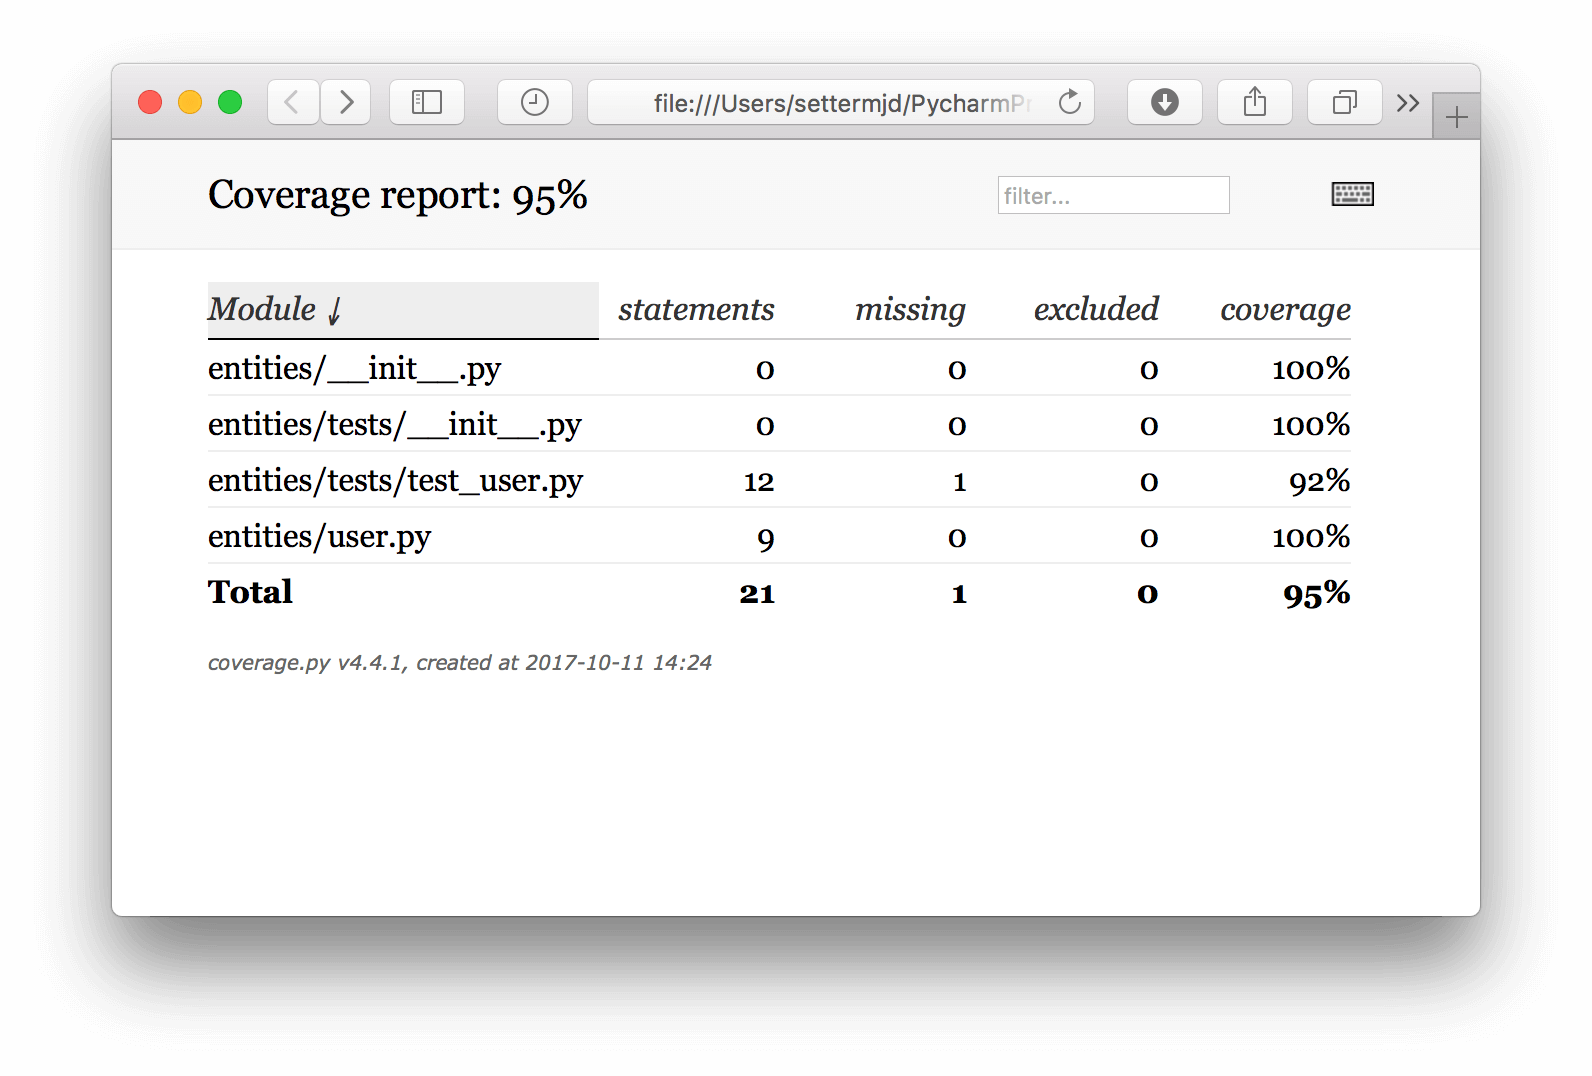
You can see that four files are included in the report. In total, there is 95 percent code coverage, because entities/tests/test_user.py only has 92 percent code coverage. This test is suitable for use with text-scanning tools but isn’t as flexible as the HTML report. Here is an example of the HTML report:
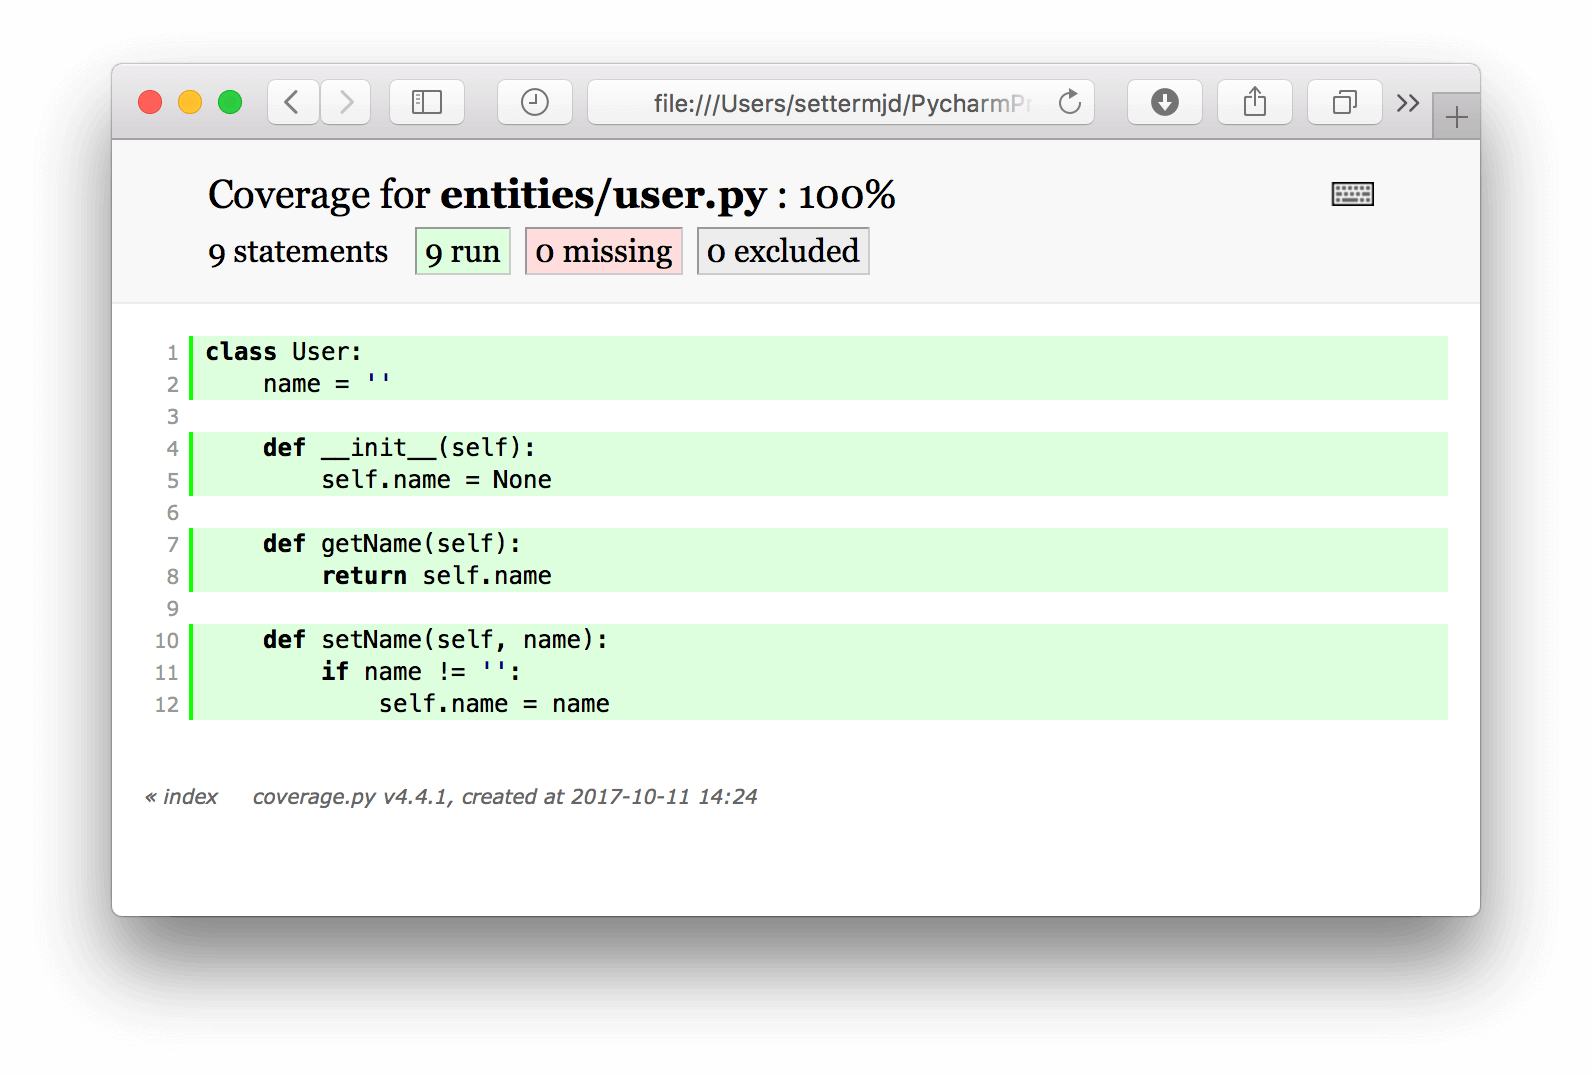
As you can see, similar to the PHPUnit report, it shows the number of statements in the class, how many were run by the tests, how many weren’t, and how many were excluded.
Java
When developing code in Java, you can use, among others, JUnit and the JaCoCo code coverage library.
The project’s documentation states that JaCoCo is a free code coverage library for Java, which has been created by the EclEmma team. JaCoCo should provide the standard technology for code coverage analysis in Java VM-based environments. The focus is providing a lightweight, flexible, and well-documented library for integration with various build and development tools.
JaCoCo supports reporting on:
- Instruction coverage
- Branch coverage
- Cyclomatic complexity
- Individual lines (for class files that have been compiled with debug information)
- Non-abstract methods that contain at least one instruction
- Class coverage
What’s more, it can be integrated with a range of build and development tools, including Ant, Maven, Eclipse, NetBeans, and IntelliJ.
JaCoCo supports creating reports in XML, HTML, and CSV formats. As Java is a lot more sophisticated than most languages and can also be more complicated than the dynamic languages, there are too many ways to cover for using JaCoCo with your application of choice.
Instead, I’m going to cover using Apache Maven to run the test suite.
After installing Maven and creating a new project in pom.xml, if you add the following plugin configuration, you can generate reports when you call man test from the command line.
<plugin>
    <groupId>org.jacoco</groupId>
    <artifactId>jacoco-maven-plugin</artifactId>
    <version>4.12</version>
    <executions>
        <execution>
            <id>prepare-agent</id>
            <goals>
                <goal>prepare-agent</goal>
            </goals>
        </execution>
        <execution>
            <id>report</id>
            <phase>prepare-package</phase>
            <goals>
                <goal>report</goal>
            </goals>
        </execution>
        <execution>
            <id>post-unit-test</id>
            <phase>test</phase>
            <goals>
                <goal>report</goal>
            </goals>
            <configuration>
                <!-- Sets the path to the file which contains the execution data. -->

                <dataFile>target/jacoco.exec</dataFile>
                <!-- Sets the output directory for the code coverage report. -->
                <outputDirectory>target/jacoco-ut</outputDirectory>
            </configuration>
        </execution>
    </executions>
    <configuration>
        <systemPropertyVariables>
            <jacoco-agent.destfile>target/jacoco.exec</jacoco-agent.destfile>
        </systemPropertyVariables>
    </configuration>
</plugin>
This configuration loads JoCoCo 4.12 as a project plugin and sets target/jacoco-ut as the directory for the generated reports.
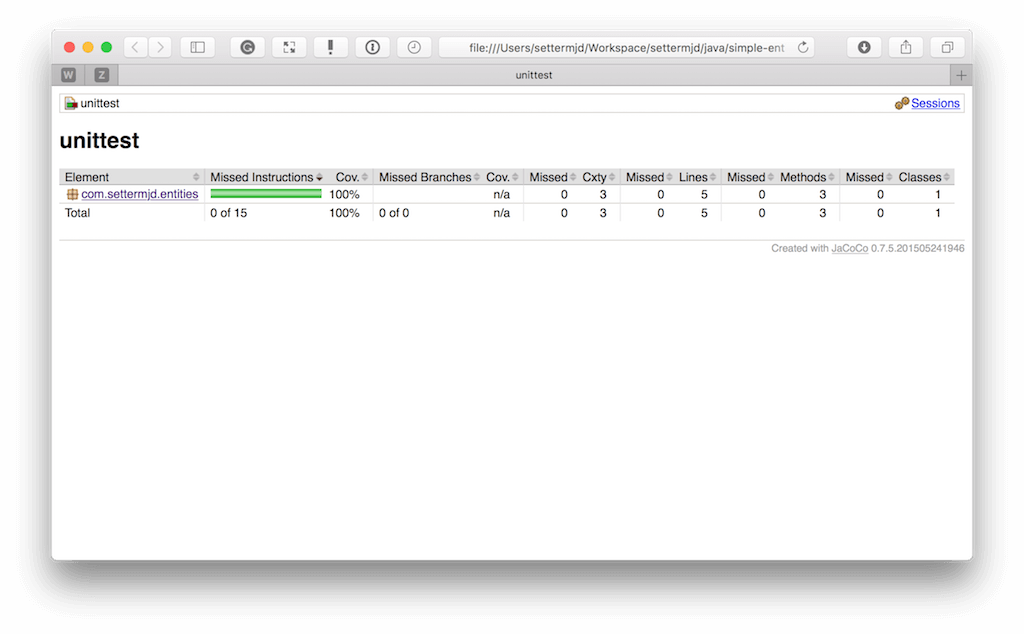
If you open target/jacoco-ut/index.html, then you’ll see a top-level report, as in the image below, which is much like the other languages’ HTML reports.
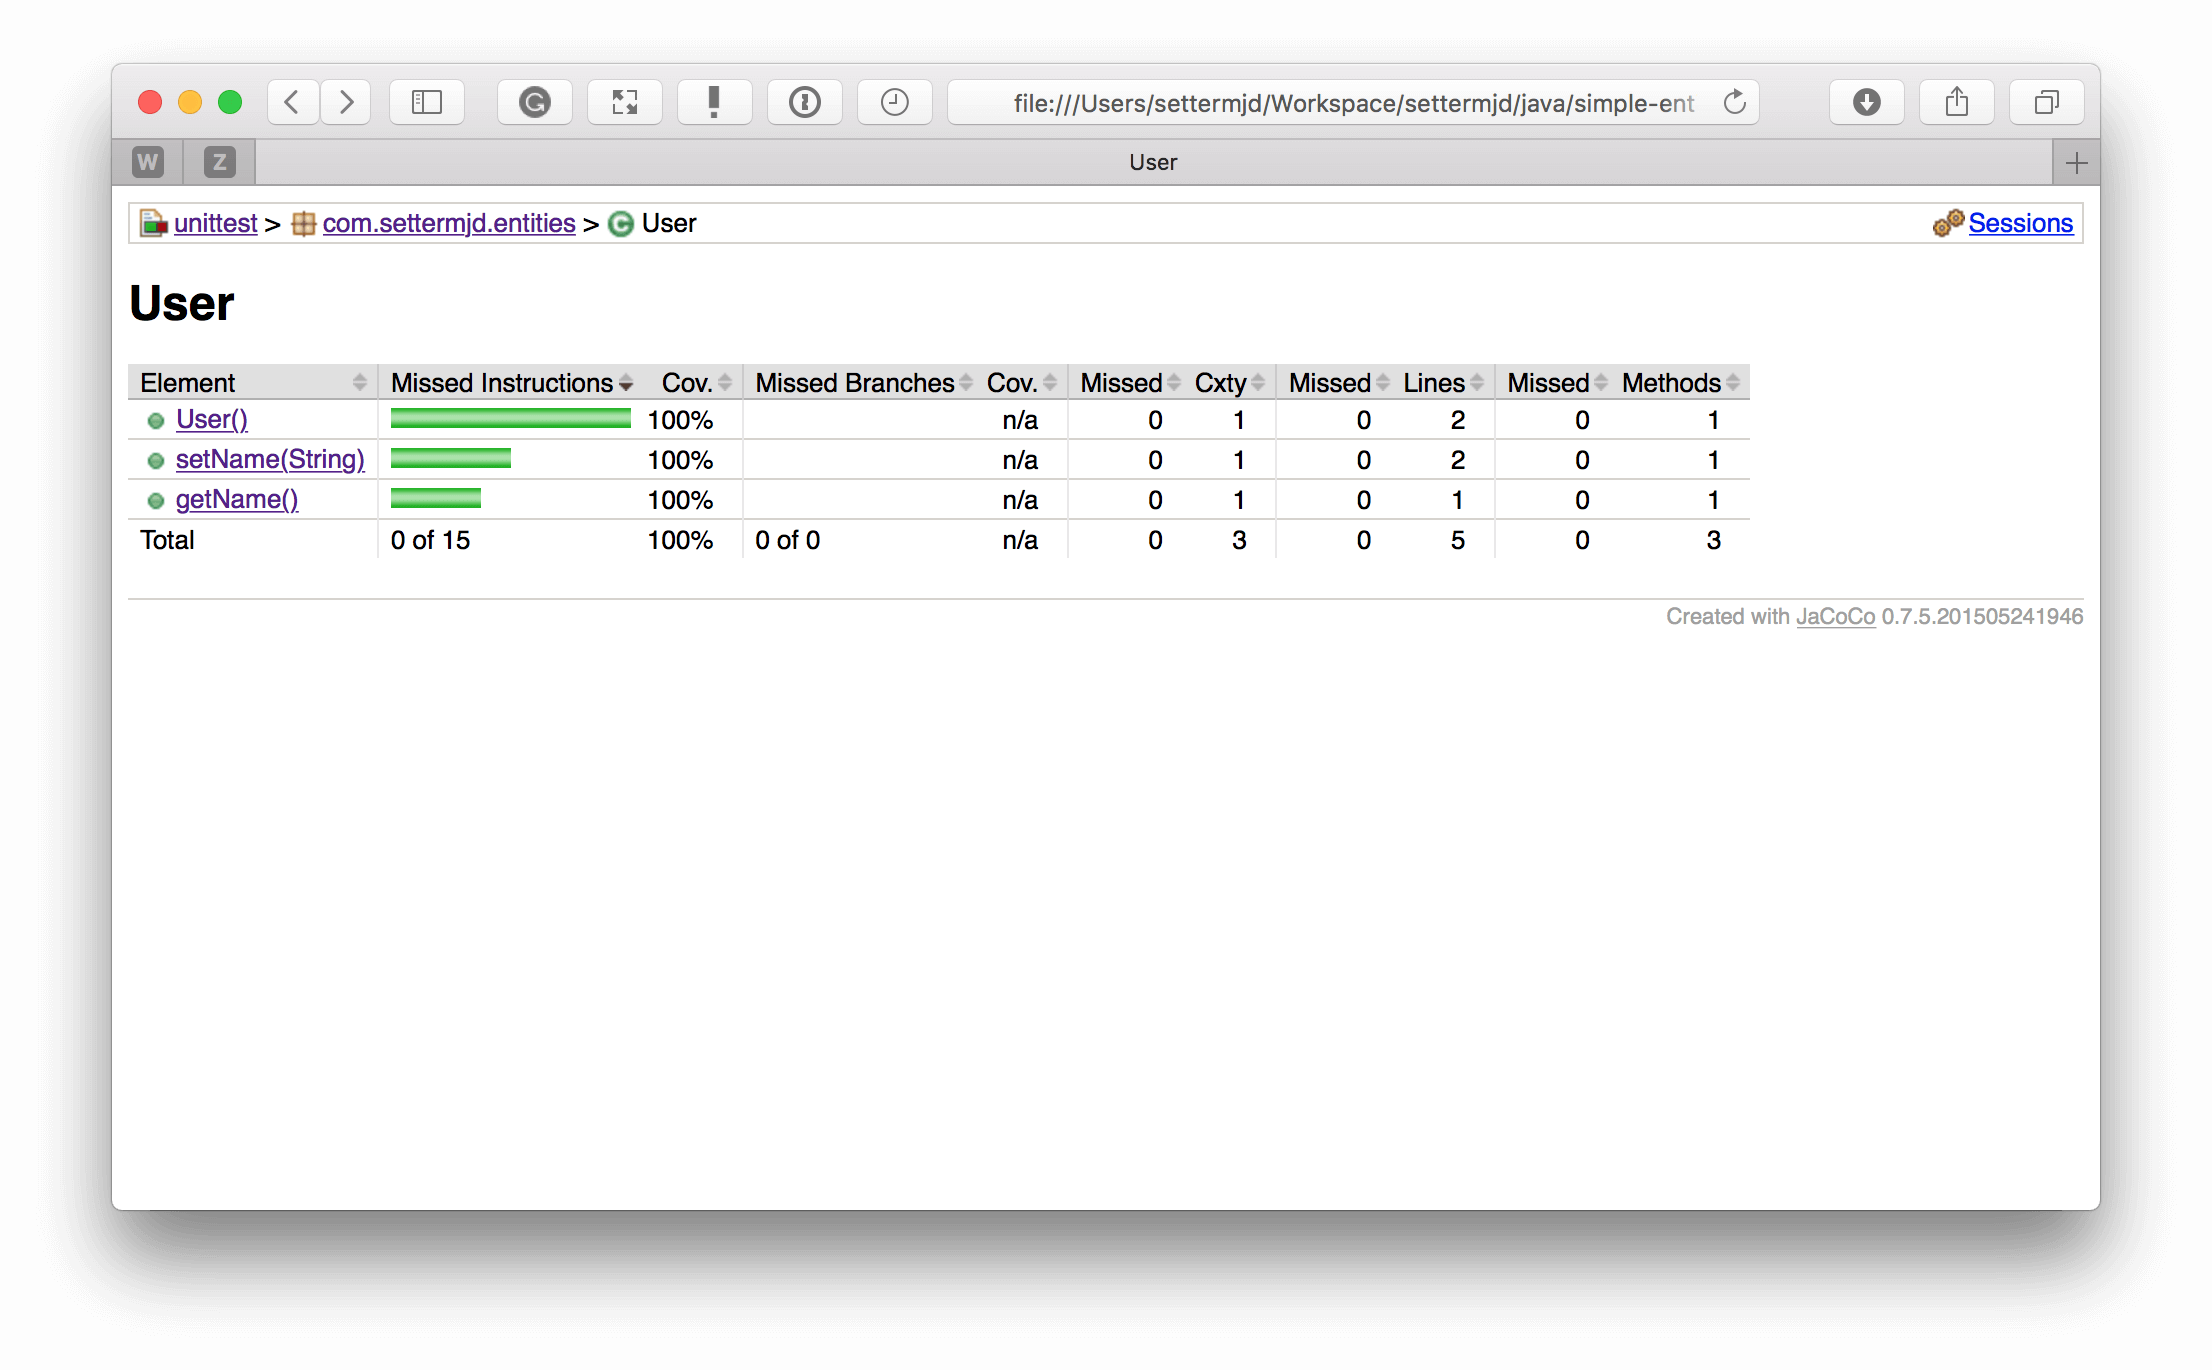
This shows the coverage of the top-level entities and folders, reporting on coverage percentage, lines, methods, and classes. If you drill down into class, you can see the same information for the methods in that class, as in the screenshot below.
And if you drill down into a method, you can see what was and what was not covered, as in the screenshot below.
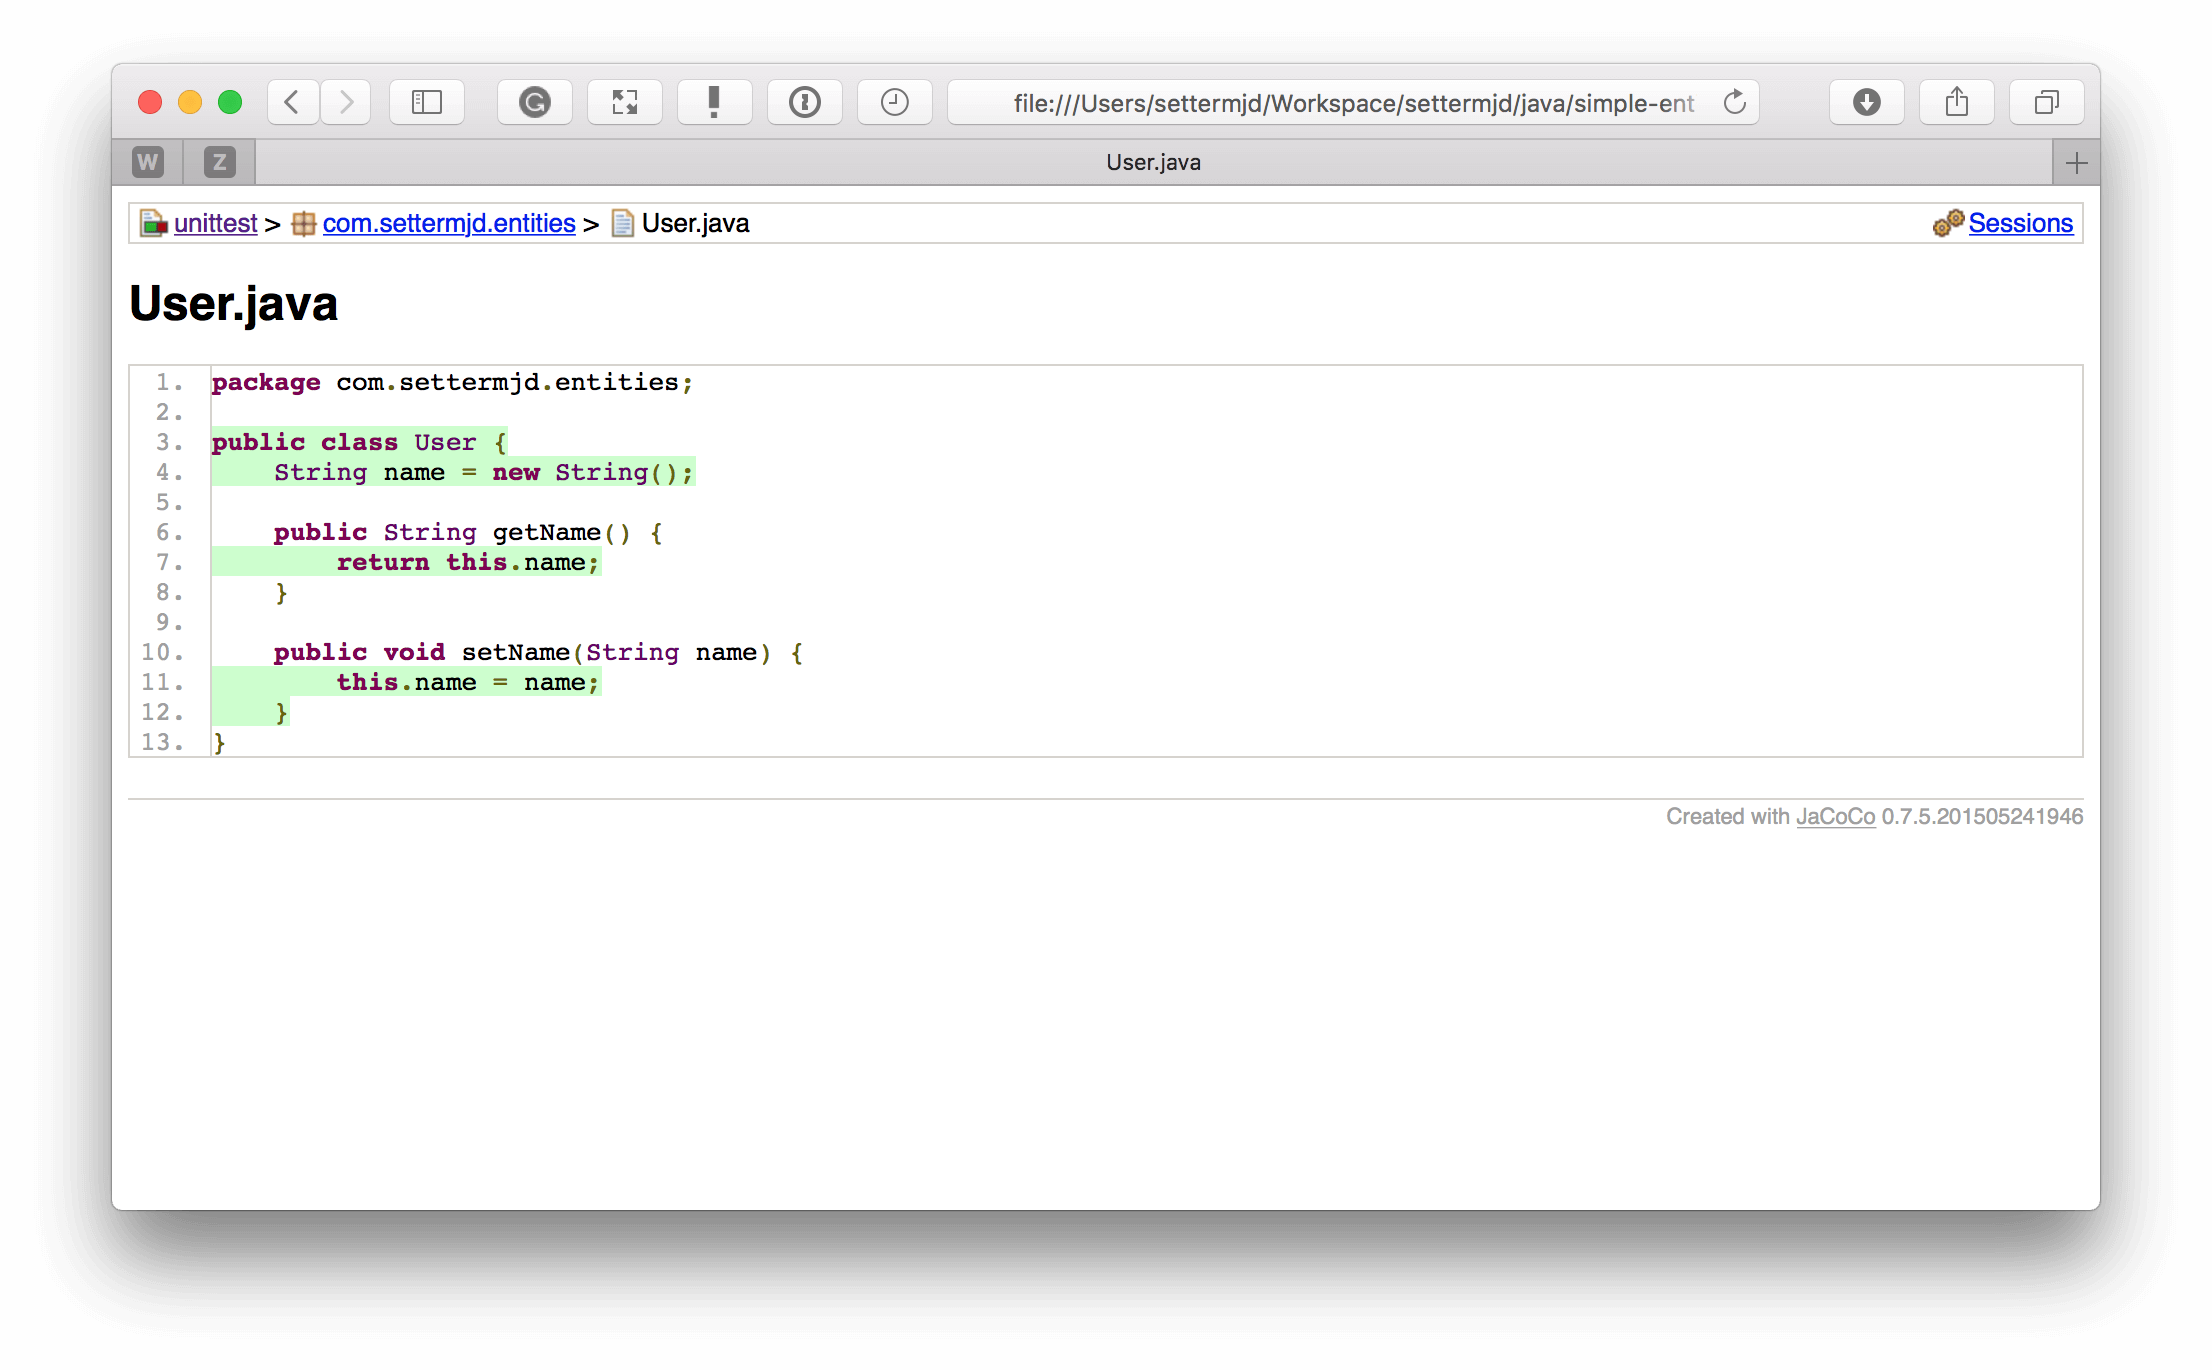
Personally, I don’t find the report structure as well thought out as those generated for many of the other packages. However, you do get the same information.
Ruby
Next, let’s look at Ruby. For Ruby, there’s SimpleCov. To quote the package’s repository, it’s…
…a code coverage analysis tool for Ruby. It uses Ruby’s built-in Coverage library to gather code coverage data, but makes processing its results much easier by providing a clean API to filter, group, merge, format, and display those results, giving you a complete code coverage suite that can be set up with just a couple lines of code.
Given that it uses Ruby’s built-in Coverage library, the library works with many Ruby testing packages, including Test::Unit/Shoulda, Cucumber, Rails, and RSpec.
From what I can tell, however, unlike code coverage in the other languages covered, Ruby’s built-in coverage library isn’t as feature-rich. However, it still provides analysis on Line, Function, Method, Class, Branch, and Path coverage.
Second, it does not output reports in XML format as the others do. However, it supports both HTML and JSON. However, as you’ll see shortly, the HTML report is nearly as feature-rich as the others, and the JSON format is both lightweight and scannable.
Installation and usage
Like most libraries and packages in Ruby, SimpleCov is easy to install. To do so, you only need to add gem 'simplecov', :require => false, :group => :test to your Gemfile, and then run bundle install. To use it, you just add the following two lines to the configuration file of your preferred testing framework:
require 'simplecov'
SimpleCov.start
During the development of the Ruby repository for this article, I used it in conjunction with RSpec. So I included it at the top of RSpec’s generated spec/spec_helper.rb file.
Example reports
After running either bundle exec rspec or bin/rspec —init, SimpleCov generated a set of reports, much like the other coverage libraries, and stored them in the project’s coverage directory.
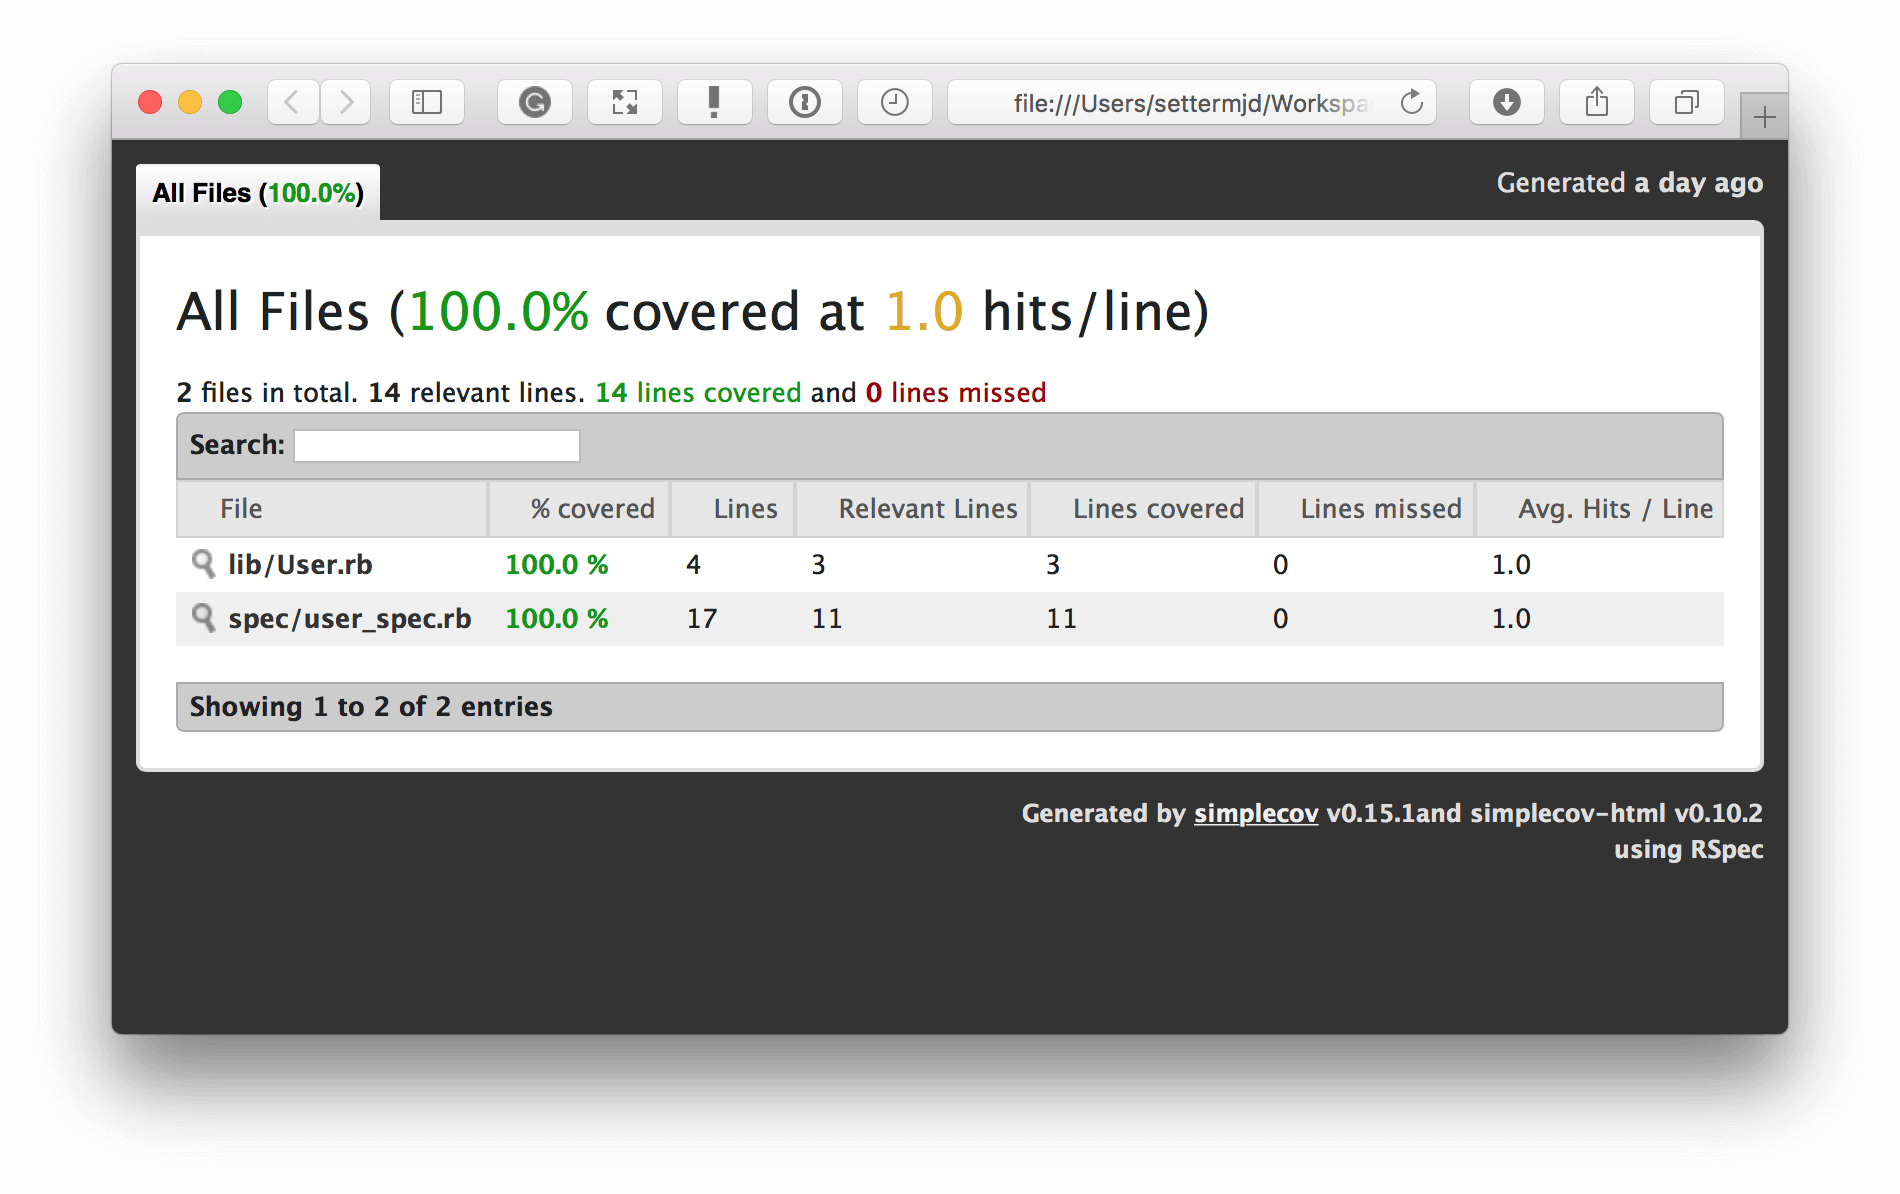
You can see in the screenshot above that the output of the HTML-based report is quite similar to the other reports. It lists the overall coverage level and shows a breakdown of how that coverage percentage is generated. For each file in the report, it lists its coverage percentage, the lines covered by tests, the lines not covered, and so on.
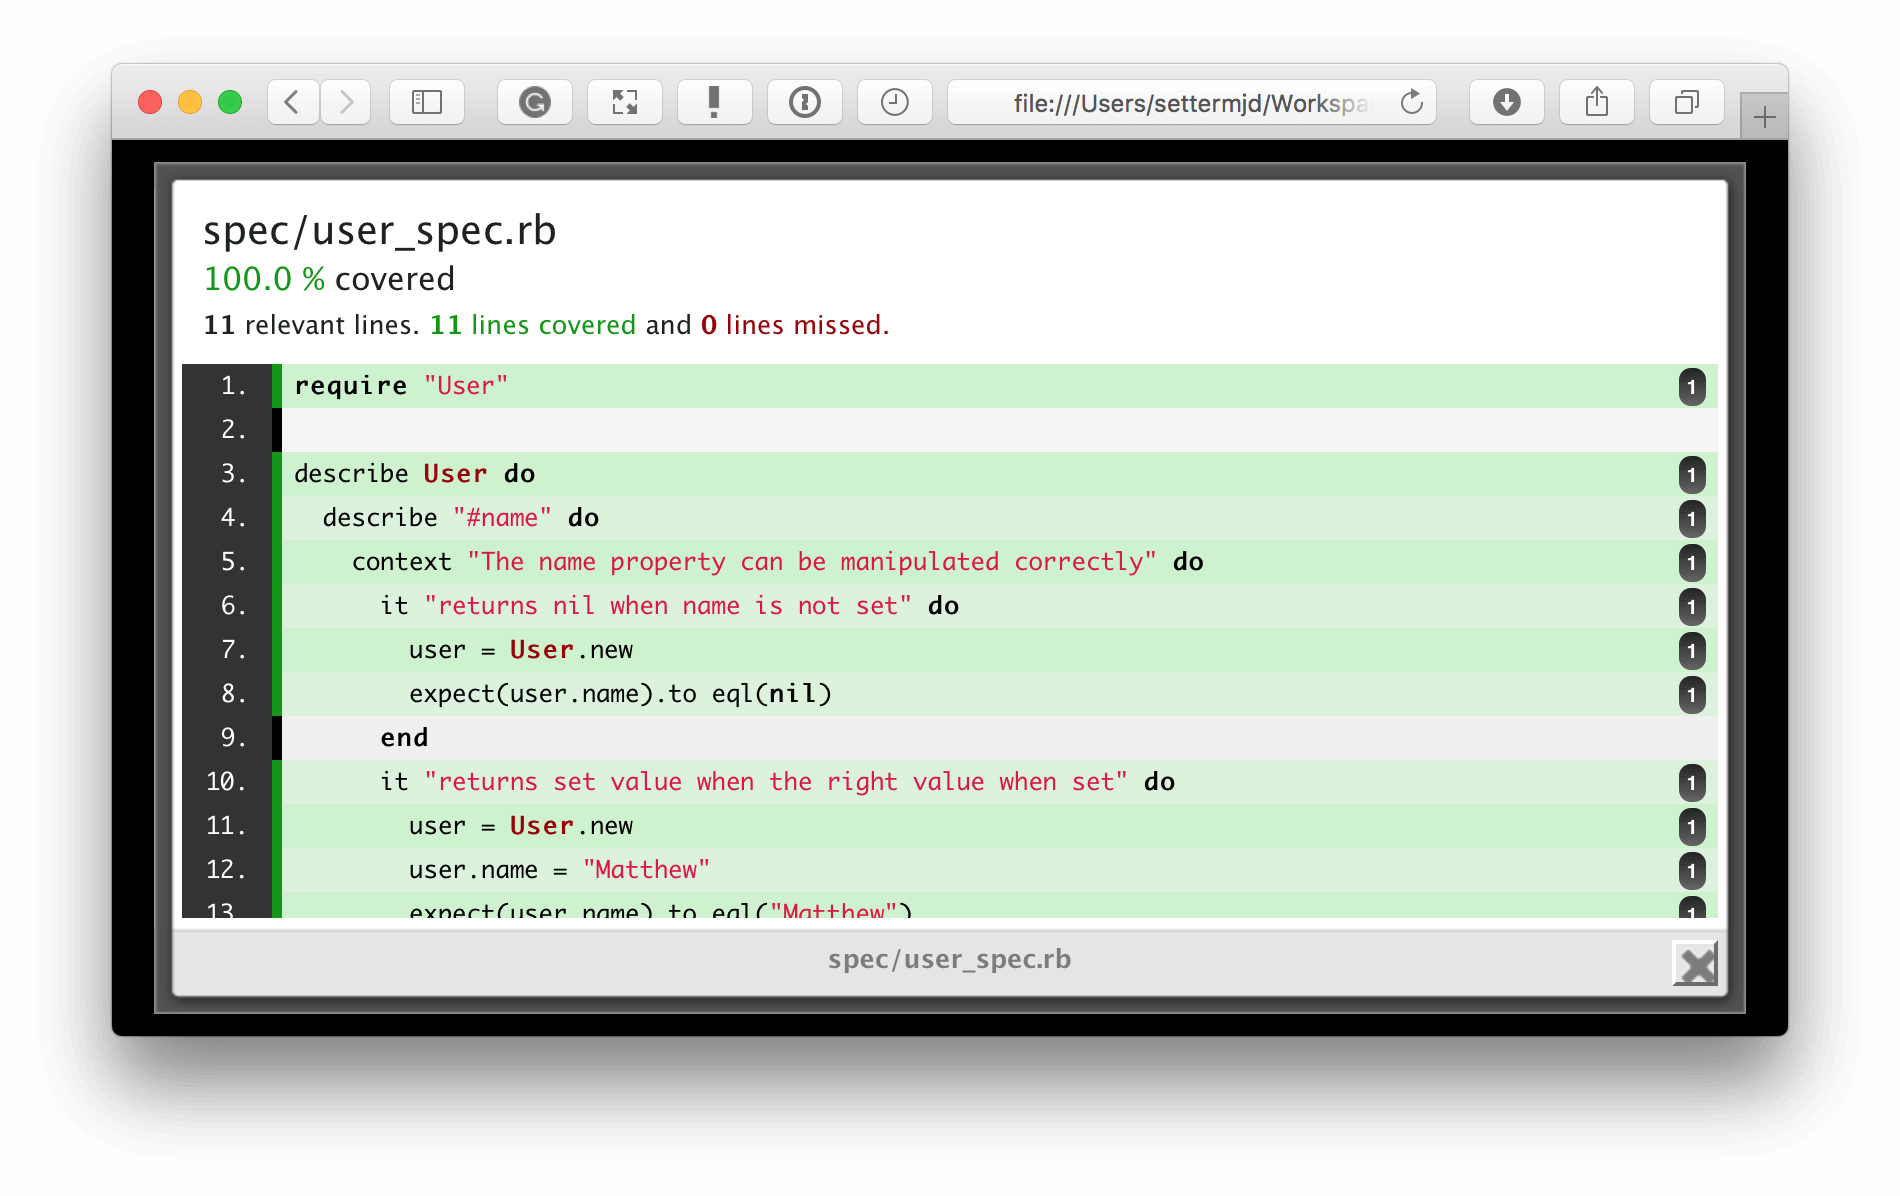
Again, as with the other HTML reports, you can click on any file in the report to see a visual representation of which lines were covered by tests and which weren’t, or in SimpleCov terms, lines that were missed.
Go
Let’s finish up by looking at code coverage in Go. Like many things in Go, code coverage support is natively provided by one of its built-in tools, Go Cover. Released as part of Go 1.2, Cover works by…
…rewriting the package’s source code before compilation to add instrumentation, compile and run the modified source, and dump the statistics.
In an excellent article on Cover, Rob Pike explains that this is a different approach than many coverage tools take because…
…(the standard approach) is difficult to implement, as analysis of the execution of binaries is challenging. It also requires a reliable way of tying the execution trace back to the source code, which can also be difficult. Problems include inaccurate debugging information and issues such as in-lined functions complicating the analysis. Most important, this approach is very non-portable. It needs to be done afresh for every architecture and to some extent for every operating system since debugging support varies significantly from system to system.
Cover analyses files in the ways that you would expect, providing analysis by Line, Function, Method, Class, Branch, and Path coverage.
Installation and usage
As Go Cover comes with Go 1.2, it is already available if you’ve installed a recent release. To run the most basic coverage analysis, run the following in a package that you’ve developed:
go test -cover
For the sample Go repository developed for this article, it renders the following output to STDOUT:
PASS
coverage: 100.0% of statements
ok      github.com/settermjd/simple-entity      0.010s
You can see that it has 100 percent coverage. Stepping up in complexity, we can generate a coverage profile by running:
go test -coverprofile=coverage.out
This command generates and stores the collected statistics in coverage.out. We can then analyze the output by running:
go tool cover -func=coverage.out
For the code in the repository, that will generate the following output:
github.com/settermjd/simple-entity/user.go:7:   setName         100.0%
github.com/settermjd/simple-entity/user.go:11:  getName         100.0%
total:                                          (statements)    100.0%
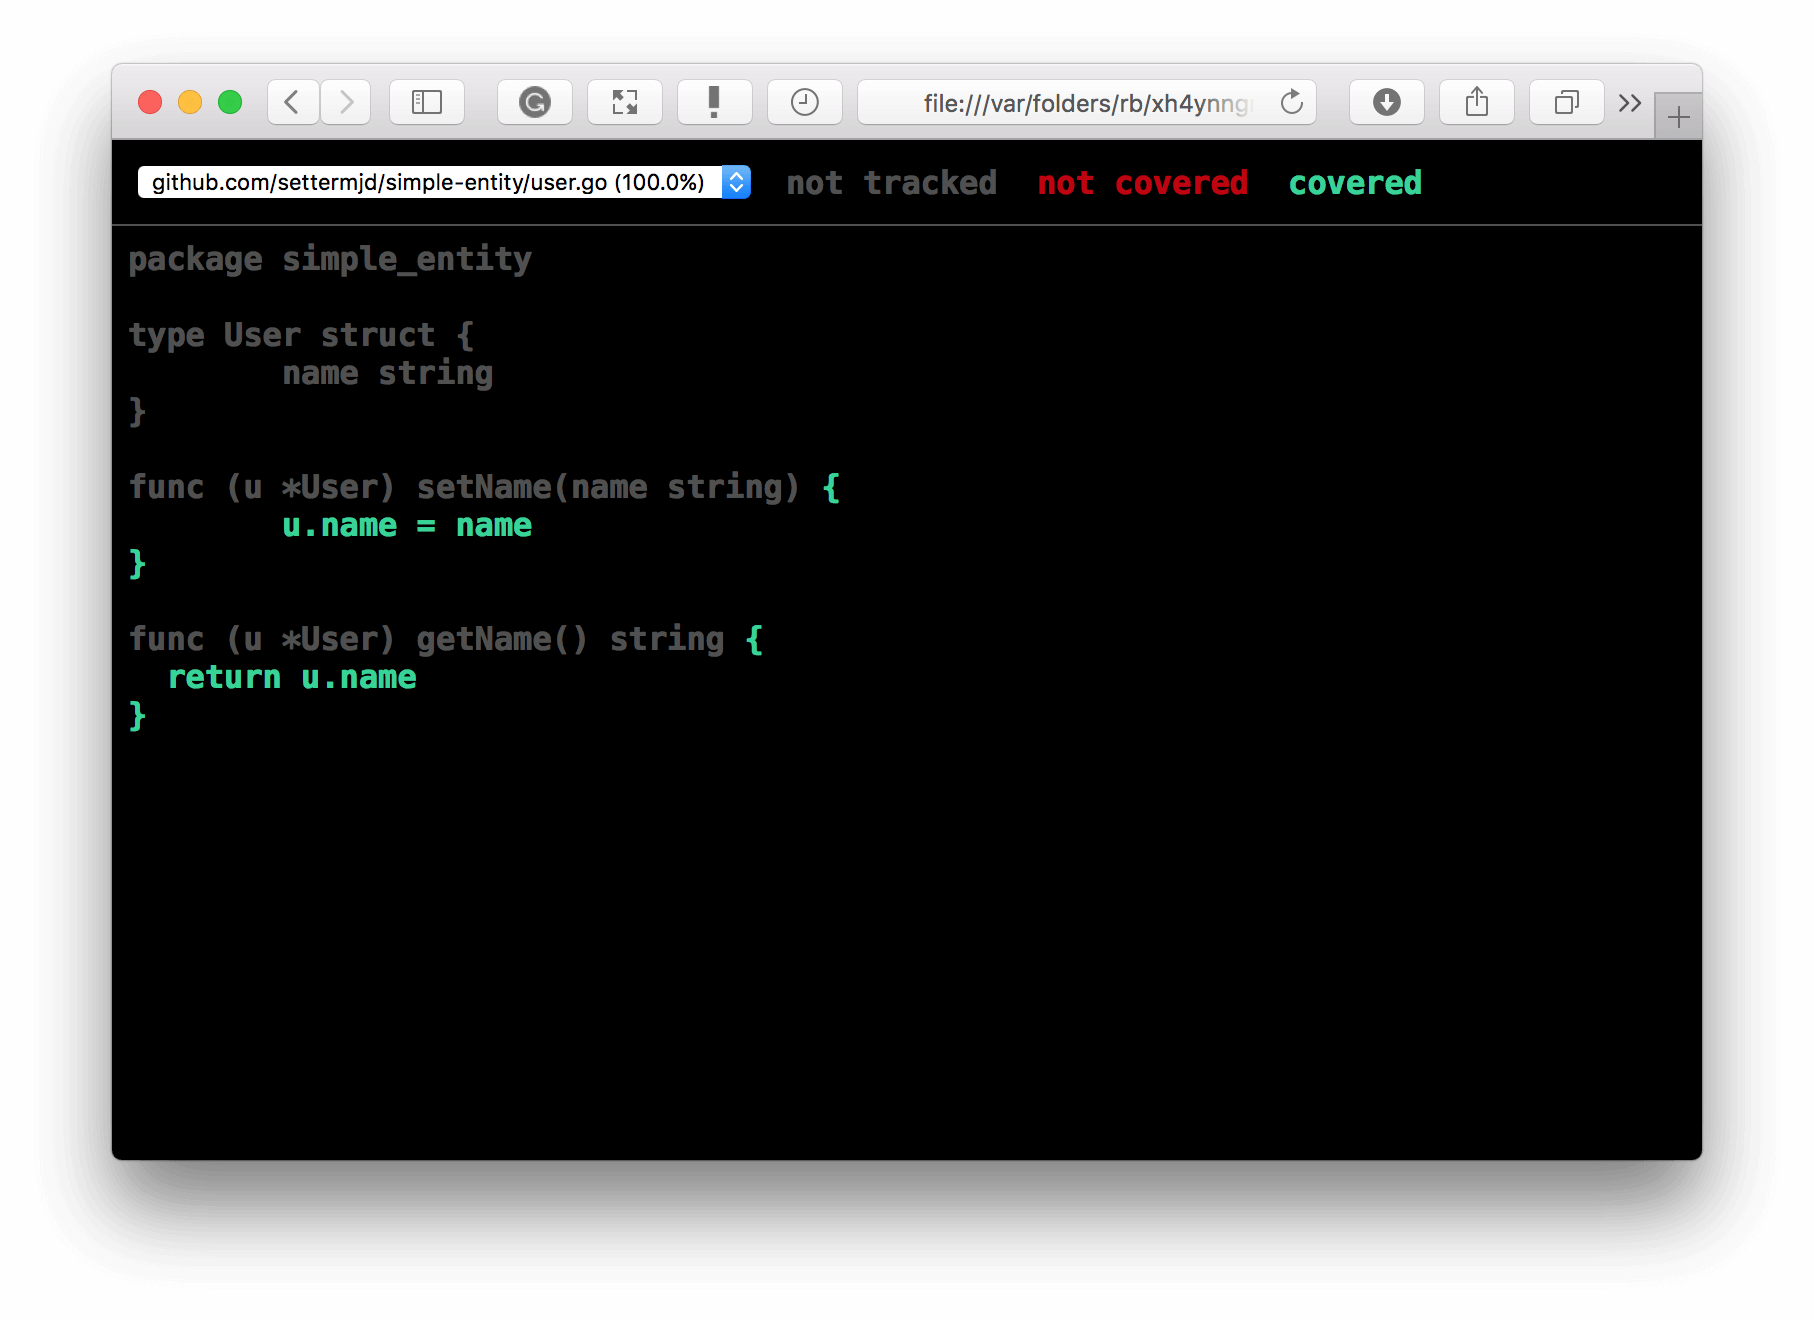
There you can see the lines and methods that make up the code coverage and the percentage of coverage attributed to them. While initially printed to STDOUT, the report is also available in HTML format by running:
go tool cover -html=coverage.out
You can see the generated report in the image below. As with the other libraries’ HTML reports, it showed what was covered in green and was not covered in red. The layout is slightly different, but the net result is the same.
In Conclusion
So that’s been a high-level look at code coverage in five of the most popular software development languages available today: Go, Python, Ruby, PHP, and Java. Some of the libraries have more functionality than others, whether in the depth of their analysis or reporting capabilities. Moreover, some are easier to start with than others.
However, regardless of the language(s) that you are developing with, you have more than enough code coverage support to assist you in measuring and improving the quality of your tests.
I strongly encourage you to start using code coverage analysis, if you’ve not started already, and to integrate it into your continuous integration and development pipelines.
Do you use a different library? Are there features that I’ve not covered? Share your feedback in the comments.
| Published on Java Code Geeks with permission by Matthew Setter, partner at our JCG program. See the original article here: The Libraries and Packages of the Code Coverage Ecosystem Opinions expressed by Java Code Geeks contributors are their own. |

