Get More Out of Splunk: Enrich Your Logs With 10x More Data
Access net new machine data, beyond log files, to enrich your Splunk instance and get real insight into application health
You’ve definitely heard of Splunk, you might even be using it at your company. It’s a powerful data aggregator that helps to simplify machine data for dev and ops teams, allowing them to capture, index and correlate real-time data in a searchable repository.
The majority of the data that they access, though, comes from log files. Log files can only provide limited insight as they contain limited variables. In fact, the majority of log statements don’t contain a single variable value. To get more value out of the tool, we need to feed it more valuable data.
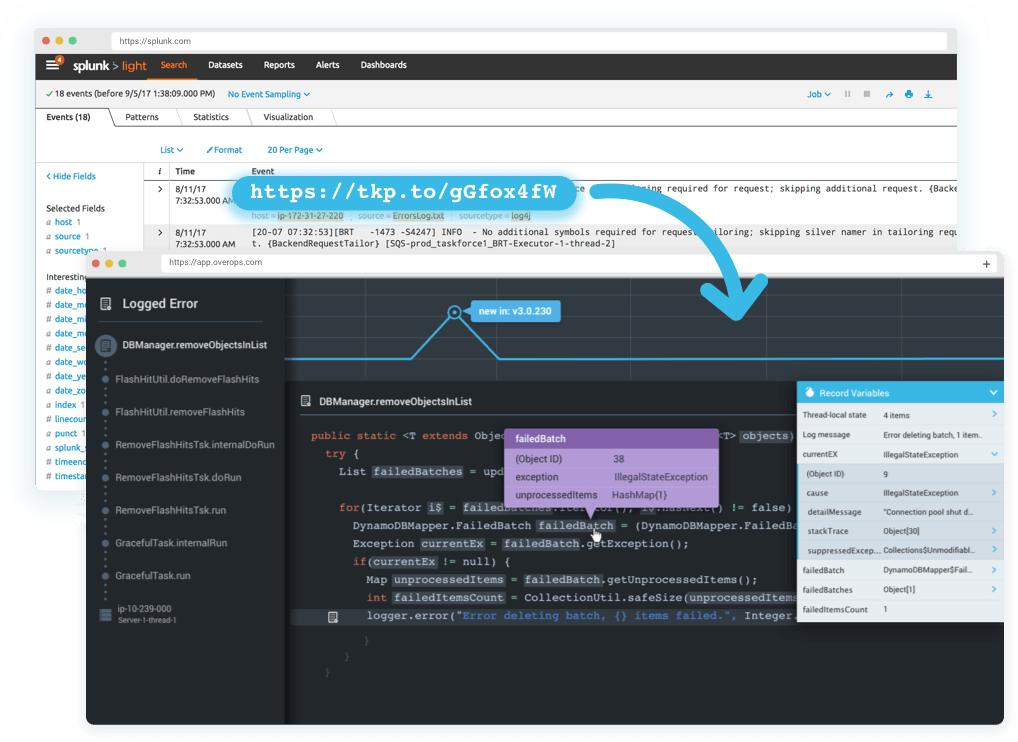
OverOps delivers net new machine data for your Splunk implementation. It provides complete, code-aware insight into every known and unknown error in your applications and services. Combined with the computational and visualization strengths of Splunk, teams are getting a better understanding of the health of their applications and are able to troubleshoot issues more quickly and with greater ease.
OverOps Platform integrates with Splunk to provide previously inaccessible data and insight across the development lifecycle:
On-click access to root cause
OverOps inserts tinylinks into your log files so you can quickly and easily access complete insight into root cause of every error directly from Splunk.
Cut through the noise
OverOps classifies and streamlines events so you can avoid parsing and searching through text to find what’s important, helping you find signal in the noise.
Visualize Reliable Software
OverOps integration with Splunk Metrics Dashboard gives you deep insight into the overall quality/reliability of your applications and services.


