Spring Boot Actuator Tutorial
Hello Friends, In this tutorial, we will learn about Spring actuator and what all it helps us with.
1. What is Spring Actuator?
2. How to add Spring actuator to Maven Project or Gradle Project?
3. Create a Spring Boot project with Spring Actuator dependency.
4. Monitoring the Application with Spring Actuator Endpoints.
What is Spring Actuator?
Once you have developed your application and it is deployed on production, it is very important to keep a check on the health of the application that is up and running, especially for mission-critical applications like Banking applications, where if customer-facing applications are down, it will directly impact the Business of the bank.
In the traditional way, before Spring Actuator, we needed to write the code to check the Health of the application, but with Spring Actuator we need not to write any code for Health Check but Spring Actuator provides some out of the box endpoints which can be very useful for Health Check up of the application.
How to add Spring actuator to Maven Project or Gradle Project?
Maven
1 2 3 4 5 6 | <dependencies> <dependency> <groupId>org.springframework.boot</groupId> <artifactId>spring-boot-starter-actuator</artifactId> </dependency></dependencies> |
Gradle
1 2 3 | dependencies { compile("org.springframework.boot:spring-boot-starter-actuator")} |
Create a Spring Boot project with Spring Actuator dependency
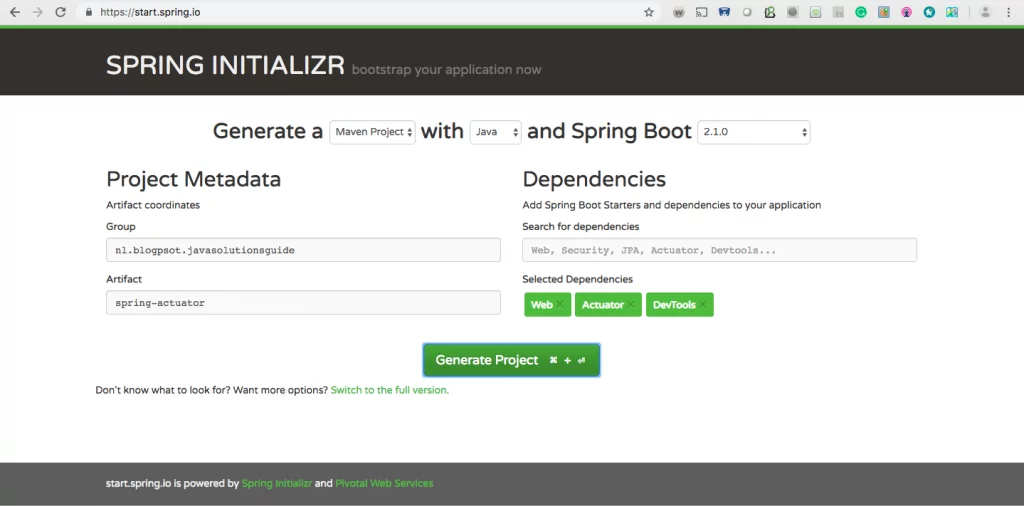
Let us go ahead and create a Spring Boot Project with Spring Actuator dependency(Along with Web and DevTools) using Spring Initializer https://start.spring.io/
Please note that as of writing this tutorial, Spring Boot version is 2.1.0
Import the project in Eclipse or any other IDE of your choice and run SpringActuatorApplication.java.
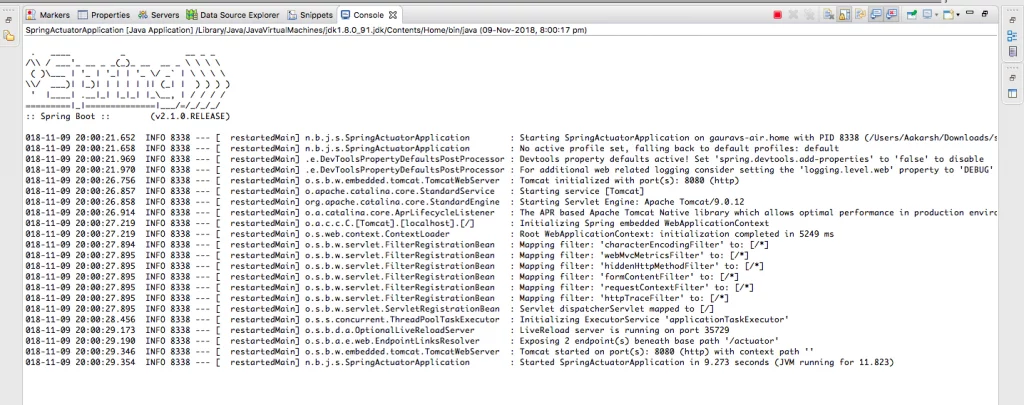
You will see following in your Eclipse console :
Which shows that embedded Tomcat has started on Port 8080 and SpringActuatorApplication has started on Tomcat. Also in console logs, you can see that actuator endpoints are exposed over /actuator URI.
018-11-09 20:00:29.346 INFO 8338 — [restartedMain] o.s.b.w.embedded.tomcat.TomcatWebServer: Tomcat started on port(s): 8080 (http) with context path ”
2018-11-09 20:00:29.354 INFO 8338 — [restartedMain] n.b.j.s.SpringActuatorApplication: Started SpringActuatorApplication in 9.273 seconds (JVM running for 11.823)
2018-11-09 20:00:29.190INFO 8338 — [restartedMain] o.s.b.a.e.web.EndpointLinksResolver: Exposing 2 endpoint(s) beneath base path ‘/actuator’.
Monitoring the Application with Spring Actuator Endpoints
As we discussed above, Spring actuator provides some out of the box endpoints which we can use to monitor the health of the application.
| ID | Description |
| auditevents | Exposes audit events information for the current application. |
| beans | Displays a complete list of all the Spring beans in your application. |
| caches | Exposes available caches. |
| conditions | Shows the conditions that were evaluated on configuration and auto-configuration classes and the reasons why they did or did not match. |
| configprops | Displays a collated list of all @ConfigurationProperties. |
| env | Exposes properties from Spring’s ConfigurableEnvironment. |
| flyway | Shows any Flyway database migrations that have been applied. |
| health | Shows application health information. |
| httptrace | Displays HTTP trace information (by default, the last 100 HTTP request-response exchanges). |
| info | Displays arbitrary application info. |
| integrationgraph | Shows the Spring Integration graph. |
| loggers | Shows and modifies the configuration of loggers in the application. |
| liquibase | Shows any Liquibase database migrations that have been applied. |
| metrics | Shows ‘metrics’ information for the current application. |
| mappings | Displays a collated list of all @RequestMapping paths. |
| scheduledtasks | Displays the scheduled tasks in your application. |
| sessions | Allows retrieval and deletion of user sessions from a Spring Session-backed session store. Not available when using Spring Session’s support for reactive web applications. |
| shutdown | Lets the application be gracefully shutdown. |
| threaddump | Performs a thread dump. |
Enable endpoints
By default, all endpoints except shutdown are enabled. To enable an endpoint, use following property in the application.properties file.
1 | management.endpoint.<id>.enabled |
Example:
To enable shutdown endpoint, we need to make following entry in the application.properties file :
1 | management.endpoint.shutdown.enabled=true |
Alternatively, we can disable all endpoints and then selectively enable the one which we want. With the following configuration, all endpoints except info will be disabled.
1 2 3 | management.endpoints.enabled-by-default=falsemanagement.endpoint.info.enabled=true |
Endpoint Actuator
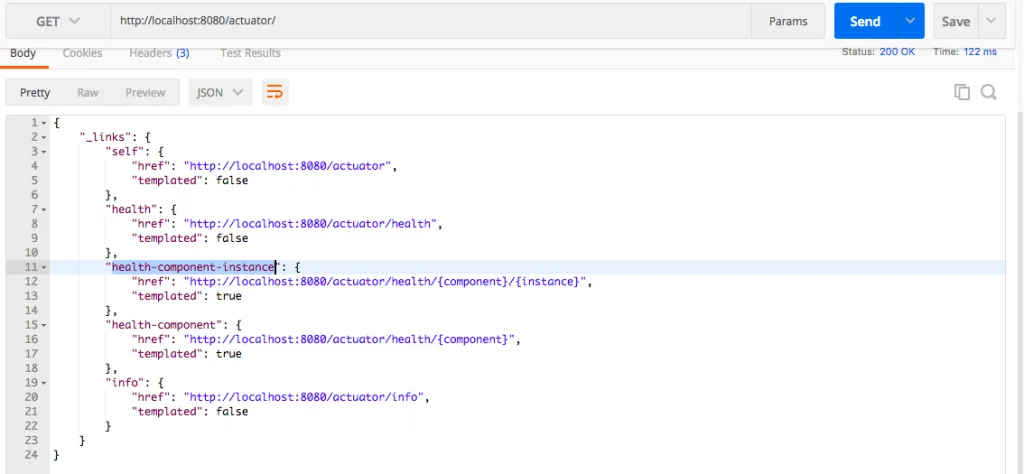
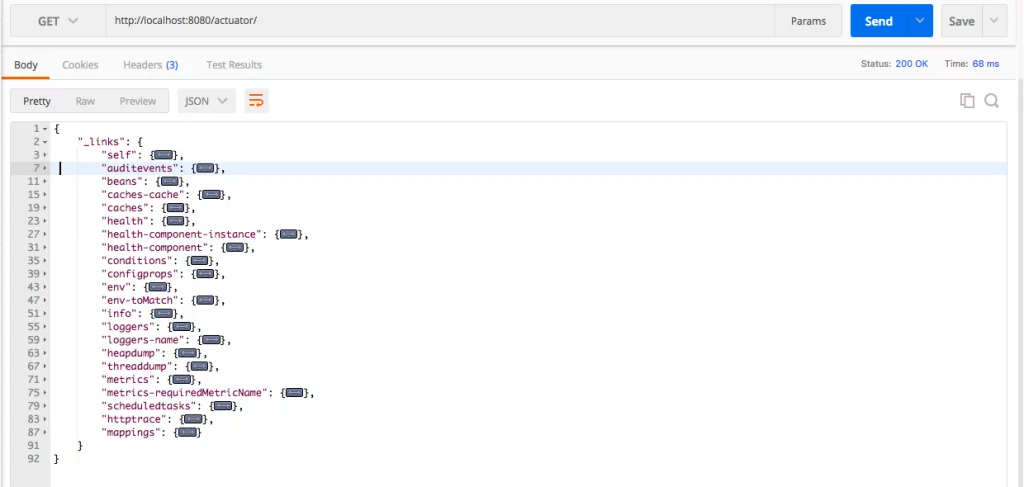
Let us hit the URL http://localhost:8080/actuator and see endpoints.
Note: I am using Postman to test endpoints as it shows JSON in a well-structured format. You are free to use any other such tool or simply a browser.
Exposing endpoints in Spring Actuator
As you would have noticed already, here only health and info endpoints can be seen. This is because these are the only endpoints which are exposed by default. All endpoints are not exposed by default for security reasons as they might have some sensitive information and hence can be compromised.
Exposing specific endpoints
If we want to expose other endpoints over Web(Http), we need to make following entries in the application.properties file.
1 | management.endpoints.web.exposure.include= <Comma separated list of Ids of endpoints which we want to expose> |
Example
1 | management.endpoints.web.exposure.include= health,info,env |
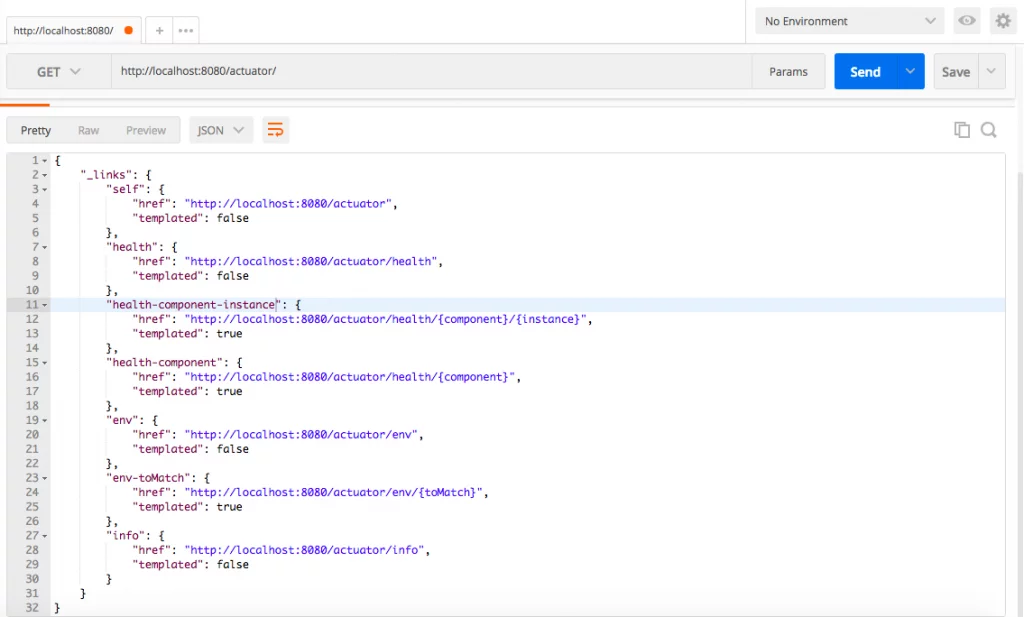
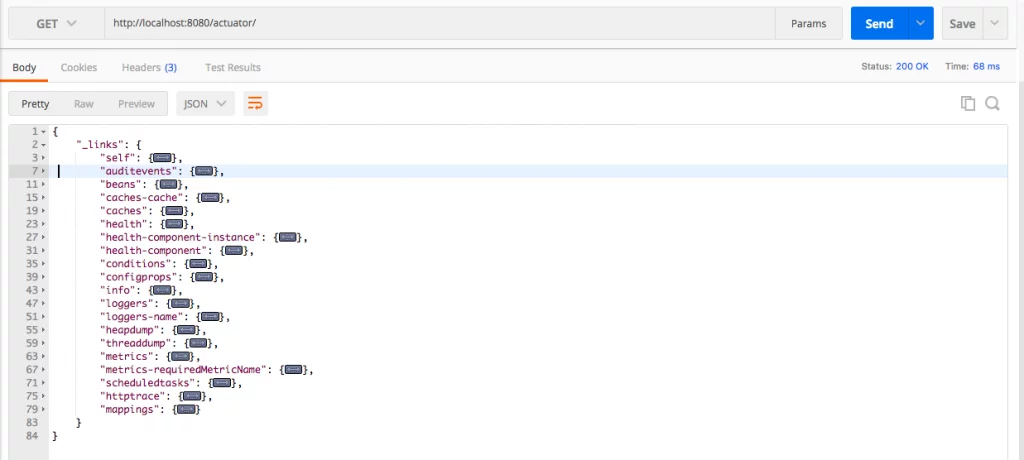
Now after adding above entry in the application.properties, let us hit URL http://localhost:8080/actuator again.
As we can see in the below screenshot, env endpoint is also enabled.
Exposing all endpoints
If we want to enable all the endpoints, we can use wildcard * as following in application.properties.
1 | management.endpoints.web.exposure.include=* |
Exposing all endpoints except few specific
Below two entries will enable all endpoints but disable only env endpoint.
1 2 3 | management.endpoints.web.exposure.include=*management.endpoints.web.exposure.exclude=env |
Disabling HTTP endpoints
If you don’t want to expose endpoints over HTTP, this can be done by configuring following in application.properties :
1 | management.server.port=-1 |
or alternatively, you can configure following in the application.properties :
1 | management.endpoints.web.exposure.exclude=* |
Customizing the actuator URL to access various endpoints
By default, all web endpoints are available under /actuator with URLs of the form /actuator/{id}.
However, it is possible to configure basepath /actuator by configuring following property in the application.properties.
1 | management.endpoints.web.base-path |
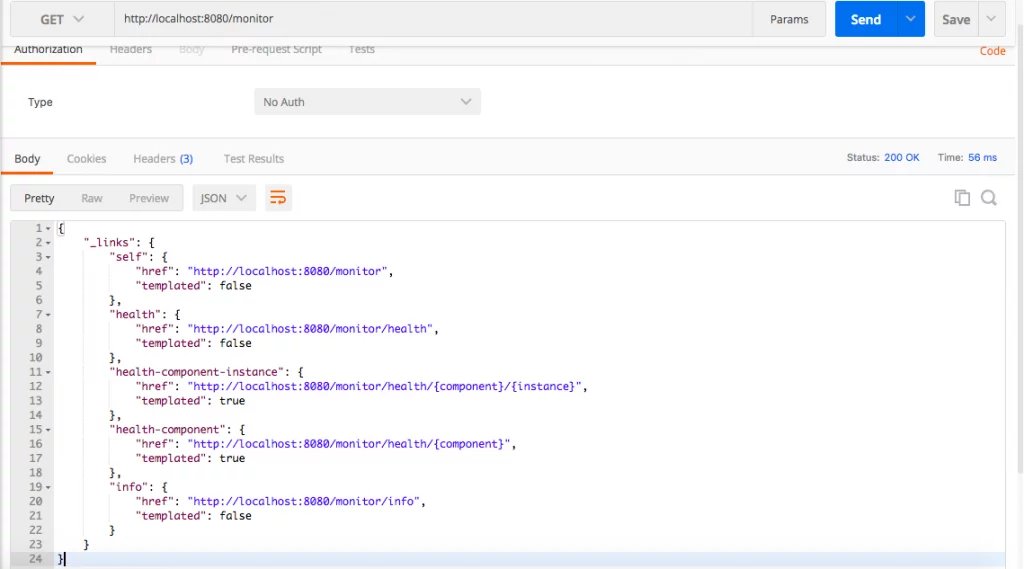
For Example, if you want to make the base URL as /monitor instead of /actuator, you
can configure in application.properties as follows:
1 | management.endpoints.web.base-path=/monitor |
With this, all endpoints can be accessed as /monitor/{id} instead of /actuator/{id}
Spring Boot Actuator endpoints
Let us discuss some of the most important endpoints.
/health
health endpoint gives the status of the application if it is Up and running or not. This is very important to monitor the application’s health when it is in production. This endpoint can be integrated with monitoring applications and will be very helpful in telling the real-time health of the applications.
Health Information
How much information for health endpoint will be exposed depends on the configuration of the property management.endpoint.health.show-details in the application.properties file.
if management.endpoint.health.show-details=never,Then details are never shown. In this case, you will see only the following information. This is the default behavior as well.
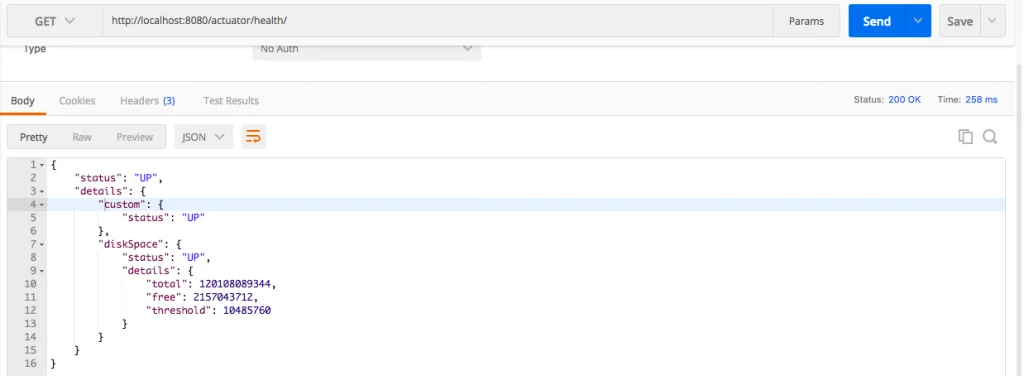
if management.endpoint.health.show-details=always, Details are shown to the all users.So as we can see in below response, we have diskspace information as well. If your application is connected to a database then you will have information about database health as well.
if management.endpoint.health.show-details=when-authorized, details are shown only to authorized users.Authorized roles can be configured using management.endpoint.health.roles property.
AutoConfigured Health Indicators
Spring Boot Actuator has lots of autoconfigured HeathIndicators to check Health of the various parts of the application. For example, Spring Boot Actuator provides DiskspaceHealthIndicator which gives information about the health of the Disk space used by the application. Similarly, if you are using MongoDB then MongoHealthIndicator will check for the health of the Mongo DB(whether is is UP) and relevant information is displayed. By default, final application status is derived by the HealthAggregator, which basically sorts the statuses from each of the HealthIndicator based on the ordered list of statuses. The first status in the sorted list is used as the final status of the application.
Disabling all Autoconfigured Health Indicators
These health indicators are enabled by default, however, it is possible to disable them with the following property :
1 | management.health.defaults.enabled=false |
Disabling individual Autoconfigured Health Indicators
Or alternatively, it is also possible to disable individual HealthIndicator as below, for example for disabling for a health check of diskspace:
1 | management.health.diskspace.enabled=false |
Note: Identifier for any HealthIndicator will be the name of the bean without HealthIndicator suffix.
For Example :
1 2 3 4 | DiskSpaceHealthIndicator diskspaceMongoHealthIndicator mongoCassandraHealthIndicator cassandraDataSourceHealthIndicator datasource |
and So on…
Custom Health Indicators
Along with the built-in HealthIndicators provided by the Spring Boot Actuator,we can create our own custom Health Indicators as well. For that, you need to create a class which implements HealthIndicator interface and implements its health() method and return Health as a response with relevant information as below :
01 02 03 04 05 06 07 08 09 10 11 12 13 14 15 16 17 18 19 | import org.springframework.boot.actuate.health.Health;import org.springframework.boot.actuate.health.HealthIndicator;import org.springframework.stereotype.Component;@Componentpublic class CustomHealthIndicator implements HealthIndicator { @Override public Health health() { int errorCode = 0; // In the above line,I am simple assigning zero,but you can call Health check related code like below commented line and that method can return the appropriate code. // int errorCode = performHealthCheck(); if (errorCode != 0) { return Health.down().withDetail("Error Code", errorCode).build(); } return Health.up().build(); }} |
Let us hit health endpoint again now and see if our custom health indicator is reflected or not.
As we can see in above screenshot that custom health check has been included.
Health Status per Component
It is also possible to check for the health status of an individual component. In the above example, we saw custom health status as well as diskSpace health status.
In case, we want to see only diskSpace health status, then we can do as follows :
http://localhost:8080/actuator/health/diskSpace
/info
info endpoint gives general information about the application which it gets from files like build-info.properties or git.properties or from any property under the key info in application.properties.
As in our project, there is no such file, so if we will hit info endpoint, it will display just empty response as below :
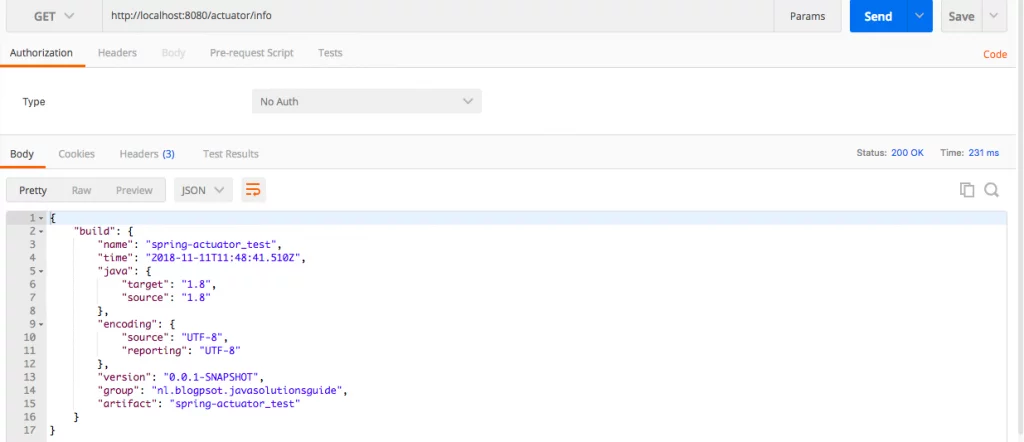
Spring Boot Actuator displays build-related information if a META-INF/build-info.properties files are present. build-info goal generates such file with the coordinates of the project and the build time. It also allows you to add an arbitrary number of additional properties.
Let us add a build-info goal in the pom.xml of our project as below in the spring-boot-maven-plugin plugin.
01 02 03 04 05 06 07 08 09 10 11 12 13 14 15 16 17 18 19 20 | <plugin> <groupId>org.springframework.boot</groupId> <artifactId>spring-boot-maven-plugin</artifactId> <version>2.1.0.RELEASE</version> <executions> <execution> <goals> <goal>build-info</goal> </goals> <configuration> <additionalProperties> <encoding.source>UTF-8</encoding.source> <encoding.reporting>UTF-8</encoding.reporting> <java.source>${maven.compiler.source}</java.source> <java.target>${maven.compiler.target}</java.target> </additionalProperties> </configuration> </execution> </executions> </plugin> |
Now let us hit info endpoint again and we can see build info as below:
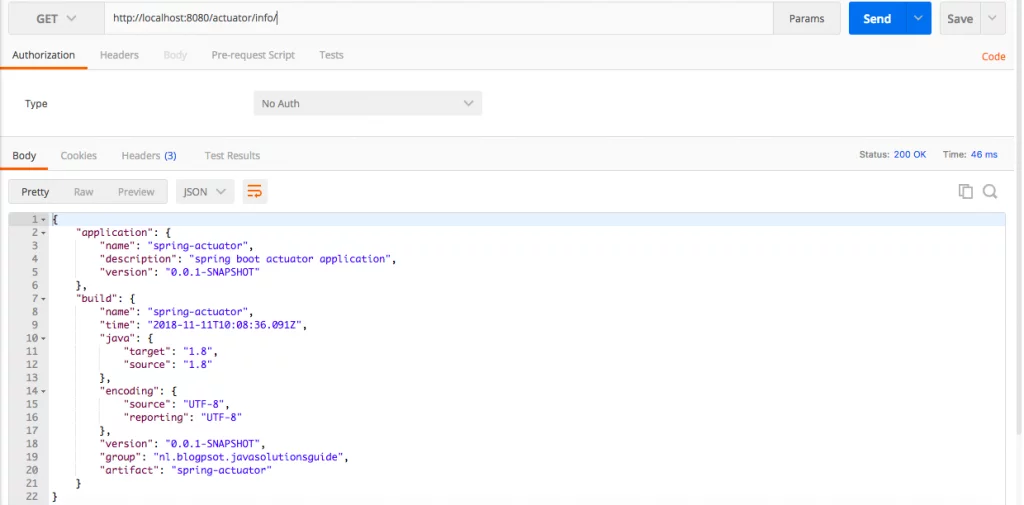
Also, we can add application information under info key in application.properties as below and same will be displayed in the /info endpoint.
1 2 3 | info.application.name=spring-actuatorinfo.application.description=spring boot actuator applicationinfo.application.version=0.0.1-SNAPSHOT |
/beans
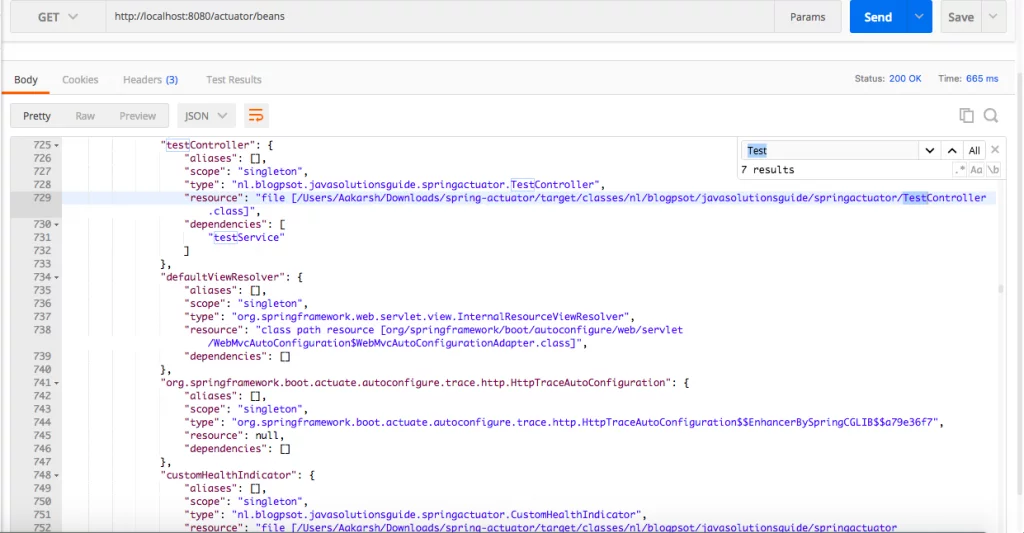
beans endpoint gives all the beans defined in the Spring bean container with the following information about each bean :
1 2 3 4 5 | aliases : Names of any aliasesScope : Scope of beantype : Fully qualified type of a bean.resource : Resource(class) in which bean is defined.dependencies :names of dependent beans. |
For example, I created a RestController with name TestController.java and injected a bean with name TestService.java
01 02 03 04 05 06 07 08 09 10 11 12 13 14 15 | import org.springframework.beans.factory.annotation.Autowired;import org.springframework.web.bind.annotation.GetMapping;import org.springframework.web.bind.annotation.RestController;@RestControllerpublic class TestController { @Autowired private TestService testService; @GetMapping("/messages") public String getMessage() { return "Hello"; }} |
1 2 3 4 5 6 | import org.springframework.context.annotation.Configuration;@Configurationpublic class TestService {} |
and you can see how it reflected in below screenshot with id testController.
/configprops
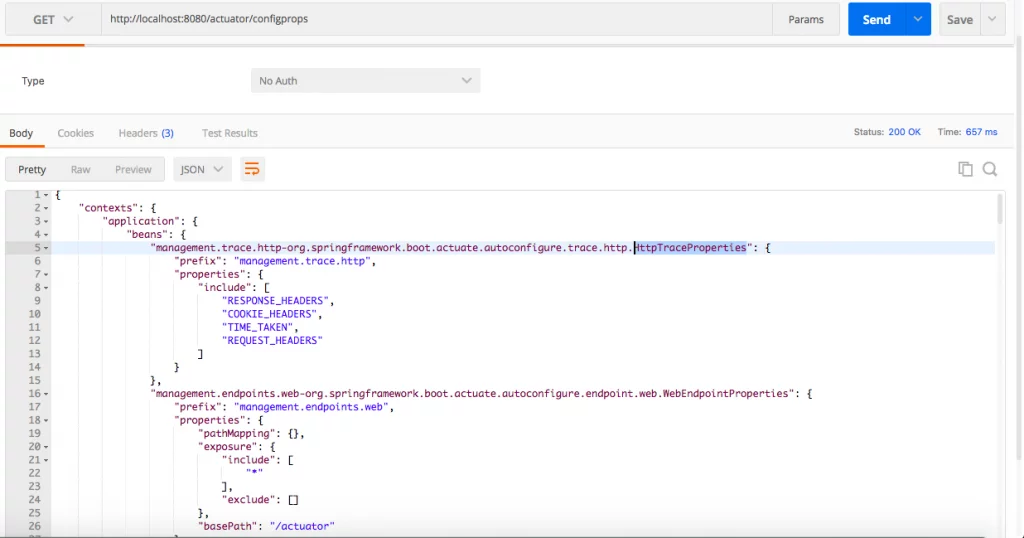
configProps endpoint give you all the beans which are annotated with @ConfigurationProperties.
In the above screenshot, we can see two beans which are predefined in Spring framework itself and are annotated with @ConfigurationProperties and hence are displayed under this endpoint.
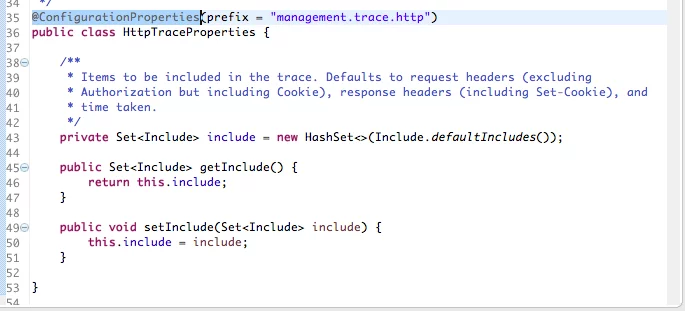
Below screenshot displays source code of HttpTraceProperties which is annotated with @ConfigurationProperties.
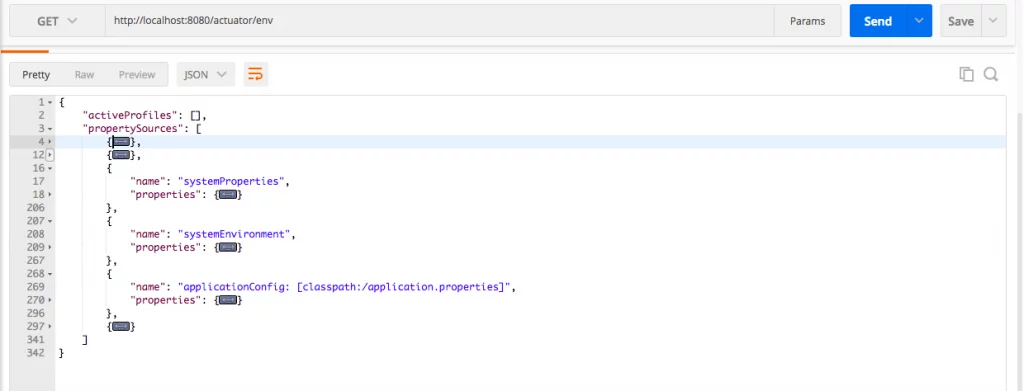
/env
env endpoint gives you all the enviorenment specific information viz in the following order :
1 2 3 | System Properties - JVM specific(Platform Independent)System Env. or Env. Variables - Operating System specific(Platform Dependent)application level configuration - Defined in application.properties |
/heapdump
heapdump endpoint gives Heap dump from the application JVM. This endpoint returns binary data in HPROF format. As the data returned is usually huge, you should save it and analyze.
/loggers
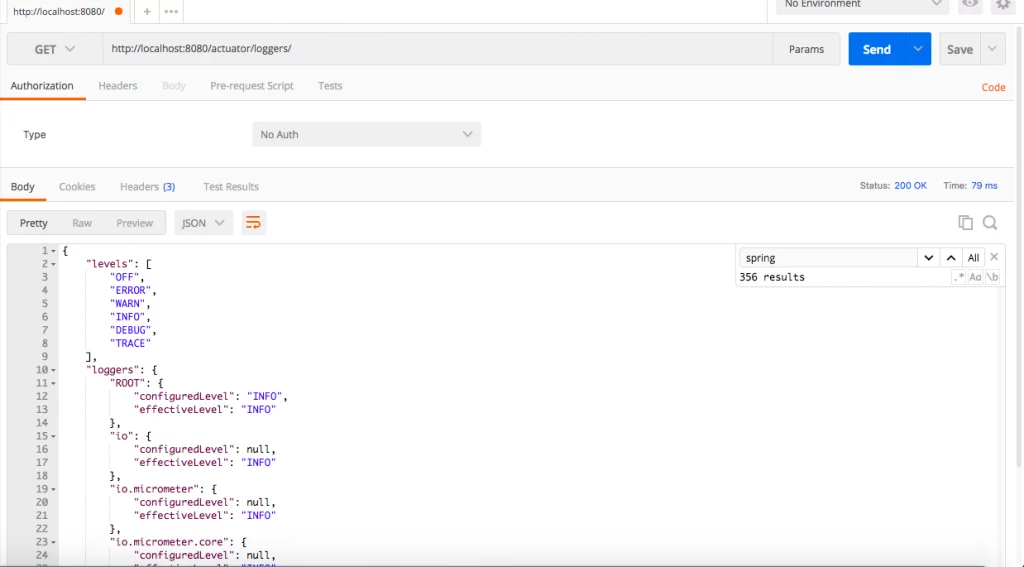
loggers endpoint gives the application’s loggers and their configuredLevel,effectiveLevel(If the configured level is null for this logger and it’s parents’ as well, the effective level will be logger level of the root logger).
levels property tells which all levels are supported by the logging framework.
logger info for a specific logger
To get logger information for a specific logger, pass the name/id of the logger in the URL after /loggers endpoint as below :
http://localhost:8080/actuator/loggers/nl.blogpsot.javasolutionsguide.springactuator.SpringActuatorApplication
/metrics
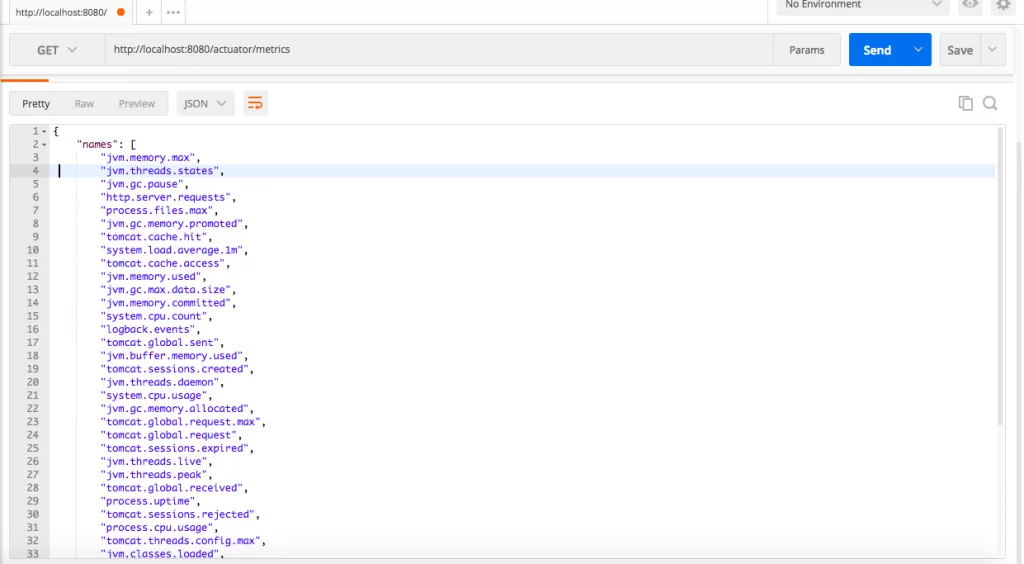
metrics endpoint gives you all the metrics which you can track for your application.
Checking individual metric
You can track individual metric by passing specific metric to the URL after /metrics endpoint as below:
http://localhost:8080/actuator/metrics/jvm.memory.used
That’s all on Spring Actuator.Thanks for reading. Please share it with someone, you think this might be helpful.
| Published on Java Code Geeks with permission by Gaurav Bhardwaj, partner at our JCG program. See the original article here: Spring Boot Actuator Tutorial Opinions expressed by Java Code Geeks contributors are their own. |










hello is there is any other way to navigate without hitting specific metric, we get value as we get in previous version can we get it now.
I wrote a tool that connects to Spring Actuator, providing a simple and intuitive UI for all its functions. Ostara, it runs locally, you just need to plug in the Actuator Endpoint URL. Any feedback would help,it’s free and open source: https://ostara.dev