Spring Boot and Micrometer with Prometheus Part 5: Spinning up prometheus
Previously we got our Spring Boot Application adapter in order to expose the endpoints for prometheus.
This blog will focus on setting up prometheus and configure it in order to server the Spring Boot Endpoints.
So let’s get started by spinning up the prometheus server using docker.

Before proceeding on spinning up prometheus we need to supply a configuration file to pull data from our application.
Thus we should supply a prometheus.yaml file with the following contents.
1 2 3 4 5 6 | scrape_configs: - job_name: 'prometheus-spring' scrape_interval: 1m metrics_path: '/actuator/prometheus' static_configs: - targets: ['my.local.machine:8080'] |
Let’s use the command taken from here.
Due to using prometheus on osx through docker, we need some workarounds to connect through the app
1 | sudo ifconfig lo0 alias 172.16.222.111 |
We can use directly docker
1 | docker run -v /path/to/prometheus.yaml:/etc/prometheus/prometheus.yml -p 9090:9090 --add-host="my.local.machine:172.16.222.111" prom/prometheus |
By doing the above we shall be able to interact with our local application from inside the docker image.
So if we navigate to http://localhost:9090/graph we shall be greeted with our prometheus screen.
Also inside our prometheus container we are also able to communicate to our application which shall run locally.
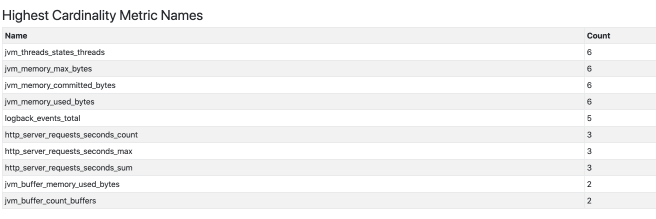
So let’s give some time and see if the data has been collected. Then let’s go to prometheus status page http://localhost:9090/status.
We shall be greeted by the JVM information of our application.

On the next blog we shall focus on securing our prometheus endpoints.
Published on Java Code Geeks with permission by Emmanouil Gkatziouras, partner at our JCG program. See the original article here: Spring Boot and Micrometer with Prometheus Part 5: Spinning up prometheus Opinions expressed by Java Code Geeks contributors are their own. |


