IBM JVM tuning – gencon GC policy
IBM JVM overview
As you probably saw from my other articles, the IBM JVM is different than the HotSpot JVM in some aspects as it does not have a PermGen memory space for example. From a garbage collection perspective, it does provide you with advanced algorithms that can take advantage of a multi physical cores machine; similar to the HotSpot JVM.
From a troubleshooting perspective, IBM provides you with many tools; including out-of-the-box Thread Dump and Heap Dump generation capabilities from its JVM implementation.
The IBM JVM Thread Dump for example is particularly powerful as it provides you extra data on your JVM such as the active JVM environment variables, GC policies, loaded classes in each active class-loader etc. We will explore this in more detail on the part 4 of our Thread Dump Training plan.
IBM VM – default GC behaviour
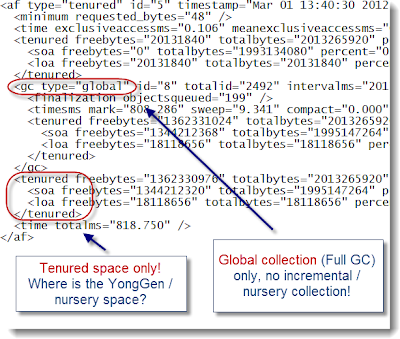
Now back to our primary topic, it is very important that you understand the default behaviour of the IBM JVM garbage collector (version 1.5 & 1.6). By default, the Java Heap space is created using tenured memory only e.g. it does not create a separate YoungGen (nursery) space. This means that any memory allocation goes to the tenured space (short lived and long lived objects) which later gets collected by the default collector (via a Full GC).
Find below a verbose GC snapshot showing you the default GC memory breakdown with explanations:
<af type="tenured" id="5" timestamp="Mar 01 13:40:30 2012" intervalms="0.000">

  <minimum requested_bytes="48" />

  <time exclusiveaccessms="0.106" meanexclusiveaccessms="0.106" threads="0" lastthreadtid="0x000000011A846B00" />

  <tenured freebytes="20131840" totalbytes="2013265920" percent="0" >

    <soa freebytes="0" totalbytes="1993134080" percent="0" />

    <loa freebytes="20131840" totalbytes="20131840" percent="100" />

  </tenured>

  <gc type="global" id="8" totalid="2492" intervalms="2017588.587">

    <finalization objectsqueued="199" />

    <timesms mark="808.286" sweep="9.341" compact="0.000" total="818.292" />

    <tenured freebytes="1362331024" totalbytes="2013265920" percent="67" >

      <soa freebytes="1344212368" totalbytes="1995147264" percent="67" />

      <loa freebytes="18118656" totalbytes="18118656" percent="100" />

    </tenured>

  </gc>

  <tenured freebytes="1362330976" totalbytes="2013265920" percent="67" >

    <soa freebytes="1344212320" totalbytes="1995147264" percent="67" />

    <loa freebytes="18118656" totalbytes="18118656" percent="100" />

  </tenured>

  <time totalms="818.750" />

</af>
Ok, default IBM JVM GC policy is different… what is the problem?
The problem with this default JVM policy is that all Java objects are copied to the tenured space and collected via a global collection (Full GC). For many Java EE applications, the ratio of short lived vs. long lived objects is much higher. This means that your JVM will need to perform quite a lot of major collections to clean up the short lived objects; results: increased frequency of Full GC, increased JVM pause time, increased CPU utilization and performance degradation!
This is exactly what we observed while performing load testing following a migration to JVM HotSpot 1.5 (using incremental & parallel GC) to IBM JVM 1.6 with default GC policy. Heavy GC process was identified as the root cause as per the above explanation.
Solution please!
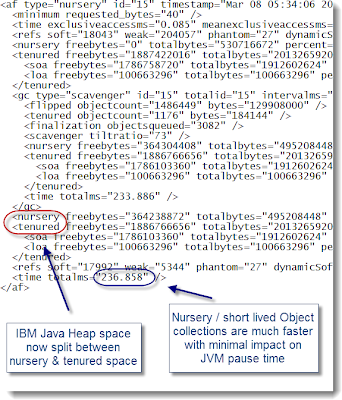
The good news is that the IBM JVM introduced generational & concurrent GC collector since version 1.5. This GC policy is providing exactly what we want:
- It does split the Java Heap space between nursery and tenured spaces
- Nursery (YoungGen) space objects are collected separately via the scavenger GC collector
- Tenured space objects are collected via the global GC collector
- The GC collector is concurrent and taking advantage of any multi physical cores machine
Results:
- Reduced major collection frequency (Full GC)
- Reduced Full GC elapsed time & pause time
- Increase JVM throughput
- Increase performance & capacity of your application
You can enable it by adding this JVM paremeter below:
-Xgcpolicy:gencon
Find below what you can expect in your verbose GC log after enabling this GC policy:
<af type="nursery" id="15" timestamp="Mar 08 05:34:06 2012" intervalms="1289096.227">

  <minimum requested_bytes="40" />

  <time exclusiveaccessms="0.085" meanexclusiveaccessms="0.085" threads="0" lastthreadtid="0x0000000118113900" />

  <refs soft="18043" weak="204057" phantom="27" dynamicSoftReferenceThreshold="32" maxSoftReferenceThreshold="32" />

  <nursery freebytes="0" totalbytes="530716672" percent="0" />

  <tenured freebytes="1887422016" totalbytes="2013265920" percent="93" >

    <soa freebytes="1786758720" totalbytes="1912602624" percent="93" />

    <loa freebytes="100663296" totalbytes="100663296" percent="100" />

  </tenured>

  <gc type="scavenger" id="15" totalid="15" intervalms="1289097.271">

    <flipped objectcount="1486449" bytes="129908000" />

    <tenured objectcount="1176" bytes="184144" />

    <finalization objectsqueued="3082" />

    <scavenger tiltratio="73" />

    <nursery freebytes="364304408" totalbytes="495208448" percent="73" tenureage="10" />

    <tenured freebytes="1886766656" totalbytes="2013265920" percent="93" >

      <soa freebytes="1786103360" totalbytes="1912602624" percent="93" />

      <loa freebytes="100663296" totalbytes="100663296" percent="100" />

    </tenured>

    <time totalms="233.886" />

  </gc>

  <nursery freebytes="364238872" totalbytes="495208448" percent="73" />

  <tenured freebytes="1886766656" totalbytes="2013265920" percent="93" >

    <soa freebytes="1786103360" totalbytes="1912602624" percent="93" />

    <loa freebytes="100663296" totalbytes="100663296" percent="100" />

  </tenured>

  <refs soft="17992" weak="5344" phantom="27" dynamicSoftReferenceThreshold="32" maxSoftReferenceThreshold="32" />

  <time totalms="236.858" />

</af>
Please keep in mind that it is still possible that your application may not benefit from this GC policy (bigger footprint of long lived objects etc.) so my recommendation to you is to always do your due diligence and perform proper capacity planning & load testing of your application before implementing any major tuning recommendations.
Conclusion
I hope this article has helped you understand the default IBM JVM 1.5/1.6 GC policy and how your Java EE application can benefit from this GC policy gencon tuning recommendation.
Reference: IBM JVM tuning – gencon GC policy from our JCG partner Pierre-Hugues Charbonneau at the Java EE Support Patterns & Java Tutorial blog.


