O11y Guide – Your First Steps in Cloud Native Observability
While I’ve been evolving the stories I’m telling for some time from developer audiences towards architecture audiences, one thing that caught my eye has been the complexities of cloud native environments. The complexer the solution architecture, the more need for simple ways of sharing how successful organizations work at cloud native scale.
Along with the journey into cloud native architectures, there has emerged a very distinct issue that is playing out across cloud native environments. That issue I’ve outlined in a series about cloud data and it’s about more than just your data storage from the early architecture days.
This look at cloud data uncovered a very interesting and somewhat hidden world of cloud native observability where the data generated keeping tabs on your cloud native architecture often can exceed your spend on running production.
This series kicks off with the basics, from developer to cloud native observability, the players involved, and outline the technical versus business story being sold to you around the tooling in cloud native observability.
Let’s dive right in, shall we?
The basic introduction starts from the point that developers are in a world without clouds and then have had to make the transition to a cloud native development world. What’s this mean for them and what are some of the challenges they are having to embrace?
It’s important to understand coming from the developer world of old, writing code for services and applications pre-cloud native, that the idea of monitoring my code as it’s working its way towards production was often very limited.
This was usually some sort of continuous integration and continuous deployment (CI/CD) toolchain that would provide me with some insights as to performance, test failures, and deployment success. Chasing down failures did not often require dashboards, other than the CI/CD one alerting to any problems. That alert would put me back in my developer environment tooling to debug by trying to decipher logged errors, test failure results, and using a lot of break points as I stepped through my code.
Most of this would be the purview of the operations department when the code hit production. They had their tooling, with log parsing, dashboards, and monitoring favourites such as Nagios.
Then came the world of cloud native development.
Developing with cloud native o11y
Slowly there was a shift where as a developer you are no longer working on your own machine or in your own datacenter hosted environments. Everything is in a cloud, or cloud like environment, which changes all business expectations.
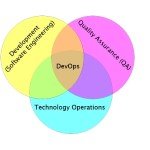
Agile development shortens the road to production with automation forcing us to move at the speed of your next code change. It also created a new landscape where operations shifted left closer to the developer and we all became DevOps teams.
New features are no longer released several times a year, but several times daily or even hourly. This brought a need for better tooling to deal with the vast array of components being created in our cloud native world. Applications make use of hundreds if not thousands of microservices and it becomes very difficult to maintain observability across these architectures.
There it is friends, the word we have landed upon in the cloud native world to represent the monitoring of everything; the rise of cloud native observability. Observability, or o11y for short, is so much more vast than anything that has happened in our developer world to date. Not only do you want to keep track of your applications and services availability, you also want to pre-detect trends that might lead to degradation or downtime of your customer’s experience.
At the start there was much talk about the three pillars of monitoring to try and tackle the challenges of cloud native o11y; metrics, tracing, and logs. The problem is that businesses are more interested in focusing on three phases; a need to know as fast as possible the problem at hand, being able to quickly triage the issue, fix it (remediation), and finally, to come to understand fundamentally what happened to prevent future occurrences.
Next up, who’s on the field
After a brief recap of the path developers and operations have taken from the old world to the new cloud native world, this article touched on the difference between the technical approach (pillars) and the business approach (phases) to cloud native o11y.
Keeping that in mind, coming up next in this series, a look at who are the players on this cloud native o11y field.
Published on Java Code Geeks with permission by Eric Schabell, partner at our JCG program. See the original article here: O11y Guide – Your First Steps in Cloud Native Observability Opinions expressed by Java Code Geeks contributors are their own. |


