How Many Threads Does It Take to Fill a Pool?
In recent months we have been seeing a small but persistent percentage of our operations fail with a strange exception – org.springframework.jdbc.CannotGetJdbcConnectionException – “Could not get JDBC Connection; nested exception is java.sql.SQLException: An attempt by a client to checkout a Connection has timed out.”
Our natural assumption was that we have some sort of contention on our C3P0 connection pool, where clients trying to acquire a connection have to wait for one to be available. Our best guess was that it is this contention that causes the timeouts.
So of course, the first thing we did was increase the max number of connections in the connection pool. However, no matter how high we set the limit, it did not help. Then we tried changing the timeout parameters of the connection. That did not produce any better results.
At this point intelligence settled in, and since guessing did not seem to work, we decided to measure. Using a simple wrapper on the connection pool, we saw that even when we have free connections in the connection pool, we still get checkout timeouts.
Investigating Connection Pool Overhead
To investigate connection pool overhead we performed a benchmark consisting of 6 rounds, each including 20,000 SQL operations (with a read/write ratio of 1:10), performed using 20 threads with a connection pool of 20 connections. Having 20 threads using a pool with 20 connections means there is no contention on the resources (the connections). Therefore any overhead is caused by the connection pool itself.
We disregarded results from the first (warm-up) run, taking the statistics from the subsequent 5 runs. From these data we gather the connection checkout time, connection release time and total pool overhead.
The benchmark project code can be found at: https://github.com/yoavaa/connection-pool-benchmark
We tested 3 different connection pools:
- C3P0 – com.mchange:c3p0:0.9.5-pre3 – class C3P0DataSourceBenchmark
- Bone CP – com.jolbox:bonecp:0.8.0-rc1 – class BoneDataSourceBenchmark
- Apache DBCP – commons-dbcp:commons-dbcp:1.4 – class DbcpDataSourceBenchmark
(In the project there is another benchmark of my own experimental async pool – https://github.com/yoavaa/async-connection-pool. However, for the purpose of this post, I am going to ignore it).
In order to run the benchmark yourself, you should setup MySQL with the following table
CREATE TABLE item (
  file_name     varchar(100) NOT NULL,
  user_guid     varchar(50) NOT NULL,
  media_type    varchar(16) NOT NULL,
  date_created  datetime NOT NULL,
  date_updated  timestamp AUTO_INCREMENT NOT NULL DEFAULT CURRENT_TIMESTAMP,
  PRIMARY KEY(file_name)
)
Then update the Credentials object to point at this MySQL installation.
When running the benchmarks, a sample result would look like this:
run, param, total time, errors, under 1000 nSec,1000 nSec - 3200 nSec,3200 nSec - 10 µSec,10 µSec - 32 µSec,32 µSec - 100 µSec,100 µSec - 320 µSec,320 µSec - 1000 µSec,1000 µSec - 3200 µSec,3200 µSec - 10 mSec,10 mSec - 32 mSec,32 mSec - 100 mSec,100 mSec - 320 mSec,320 mSec - 1000 mSec,1000 mSec - 3200 mSec,other
0, acquire,29587,0,0,5,1625,8132,738,660,1332,1787,2062,2048,1430,181,0,0,0
0, execution, , ,0,0,0,0,0,0,0,1848,6566,6456,5078,52,0,0,0
0, release, , ,0,8,6416,9848,3110,68,77,115,124,148,75,11,0,0,0
0, overhead, , ,0,0,49,4573,5459,711,1399,1812,2142,2157,1498,200,0,0,0
1, acquire,27941,0,0,125,8153,499,658,829,1588,2255,2470,2377,1013,33,0,0,0
1, execution, , ,0,0,0,0,0,0,6,1730,6105,6768,5368,23,0,0,0
1, release, , ,0,49,15722,3733,55,42,69,91,123,101,14,1,0,0,0
1, overhead, , ,0,0,2497,5819,869,830,1610,2303,2545,2448,1042,37,0,0,0
This information was imported into an Excel file (also included in the benchmark project) for analysis.
C3P0
It is with C3P0 that we originally saw the original exception in our production environment. Let’s see how it performs:
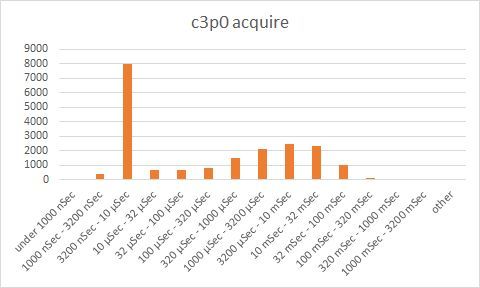
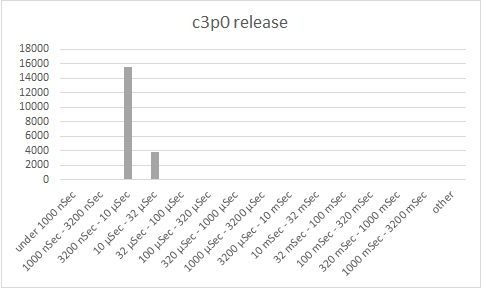
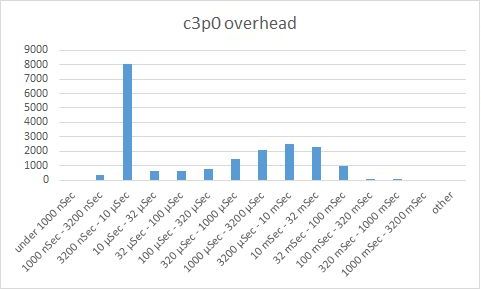
Reading the charts:
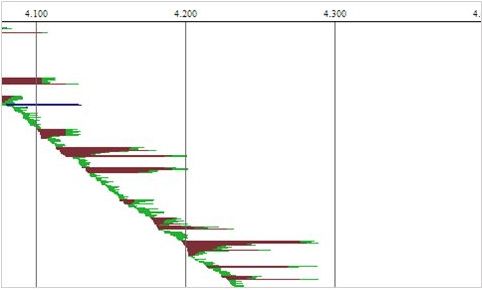
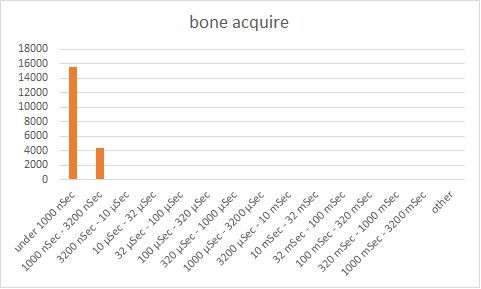
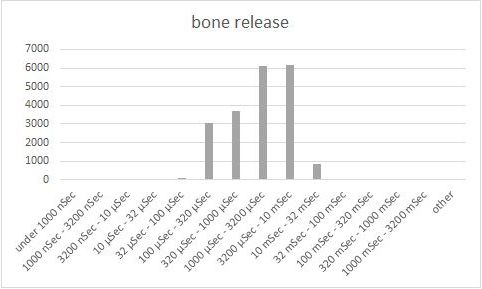
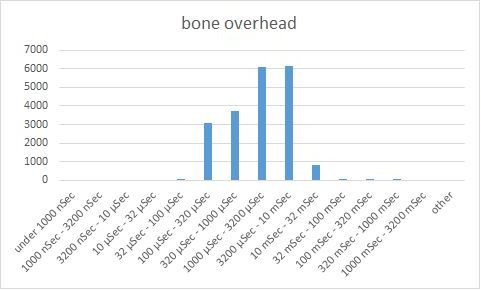
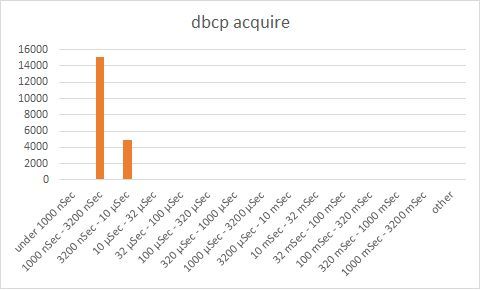
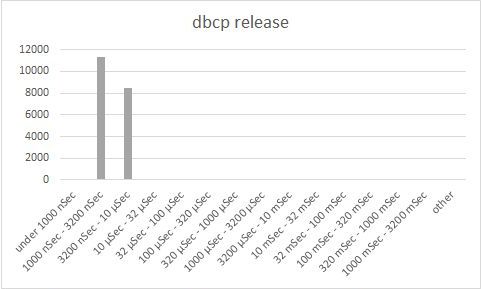
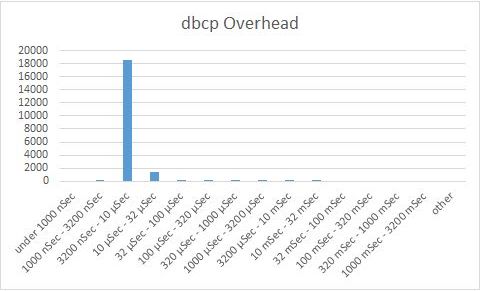
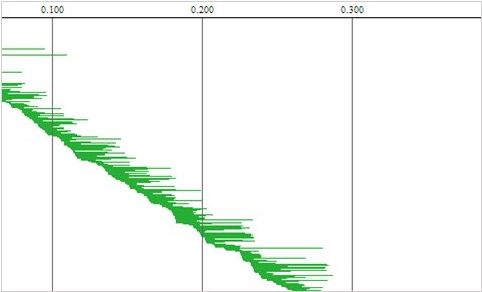
The first three charts (acquire, release, overhead) are bucket charts based on performance. The Y-axis indicates the number of operations that completed within a certain time range (shown on the X-axis). The default rule of thumb here is that the higher the bars to the left, the better. The 4th chart is a waterfall chart, where each horizontal line indicates one DB operation. Brown indicates time waiting to acquire a connection, green is time to execute the DB operation, blue indicates time to return a connection to the connection pool.
Looking at the charts, we see that generally, C3P0 acquires a connection within 3.2-10 microseconds and releases connections within 3.2-10 microseconds. That is definitely some impressive performance. However, C3P0 has also another peak at about 3.2-32 milliseconds, as well as a long tail getting as high as 320 – 1000 milliseconds. It is this second peak that causes our exceptions.
What’s going on with C3P0? What causes this small but significant percentage of extremely long operations, while most of the time performance is pretty amazing? Looking at the 4th chart can point us in the direction of the answer.
The 4th chart has a clear diagonal line from top left to bottom right, indicating that overall, connection acquisition is starting in sequence. But we can identify something strange – we can see brown triangles, indicating cases where when multiple threads try to acquire a connection, the first thread waits more time than subsequent threads. This translates to two performance ‘groups’ for acquiring a connection. Some threads get a connection extremely quickly, whereas some reach starvation waiting for a connection while latecomer threads’ requests are answered earlier.
Such a behavior, where an early thread waits longer than a subsequent thread, means unfair synchronization. Indeed, when digging into C3P0 code, we have seen that during the acquisition of a connection, C3P0 uses the ‘synchronized’ keyword three times. In Java the ‘synchronized’ keyword creates an unfair lock, which can cause thread starvation.
We may try patching C3P0 with fair locks later on. If we do so, we will naturally share our findings.
The C3P0 configuration for this benchmark:
- Minimum pool size: 20
- Initial pool size: 20
- Maximum pool size: 20
- Acquire increment: 10
- Number of helper threads: 6
BoneCP
We have tried BoneCP at Wix with mixed results, so that at the moment we are not sure if we like it. We include the results of the BoneCP benchmarks in these posts, though the analysis is not as comprehensive.
Looking at the charts, we can see that Bone’s connection acquisition performance is outstanding – most the operations are completed within 3.2 microseconds, much faster than C3P0. However, we also observe that the connection release time is significant, about 1-10 milliseconds, way too high. We also observe that Bone has a long tail of operations with overhead getting as high as 320 milliseconds.
Looking at the data, it appears BoneCP is better compared to C3P0 – both in the normal and ‘extreme’ cases. However, the difference is not large, as is evidenced by the charts. Looking at the 4th chart, we see we have less brown compared to C3P0 (since connection acquisition is better) but trailing blue lines have appeared, indicating the periods of time that threads wait for a connection to be released.
As mentioned above, since we are ambivalent at best about using BoneCP, We have not invested significant resources in analyzing this connection pools’ performance issues.
Apache DBCP
Apache DBCP is known as the Old Faithful of datasources. Let’s see how it fares compared to the other two.
One thing is evident – DBCP performance is superior to both C3P0 and Bone. In all regards, it outperforms the other alternatives, whether in terms of connection checkout times, connection release time and in the form of the waterfall chart.
So What Datasource Should You Be Using?
Well, that is a non-trivial question. It is clear that with regards to connection pool performance, we have a clear winner – DBCP. It also seems that C3P0 should be easy to fix, and we may just try that.
However, it is important to remember that the scope of this investigation was limited only to the performance of the actual connection acquisition/release. Actual datasource selection is a more complex issue. This benchmark for example, ignores some important aspects, such as growth and shrinkage of the pool, handling of network errors, handling failover in case of DB failure and more.




Really insightful article! It would become a hit if you compare Transaction Manager internal pools as well, especially Atomikos and Bitronix.
You should also review a Tomcat JDBC Connection Pool (http://tomcat.apache.org/tomcat-7.0-doc/jdbc-pool.html)…
Please update this article with HikariCP. Thanks!
HikariCP comparison:
http://engineering.wix.com/2015/04/28/how-does-hikaricp-compare-to-other-connection-pools/