Debugging a Production Server – Eclipse and JBoss showcase
Do you write code that has bugs? No, of course not. For the rest of us, mere mortals, who do write code with bugs, I would like to address a very sensitive issue: debugging an application that runs on a production server.
So, your application is ready for deployment. Unit tests were all successful, testers found some minor bugs that were immediately fixed, the integration tests with the other department’s modules went pretty smoothly, the QA department made no complaints and the UATs were passed with flying colors. Thus, your awesome code is now up and running on the production server.
When the unthinkable happens. Your client notices some buggy behavior on the application and some of his customers have already started complaining. It seems that some nasty little bug has managed to get through all the testing procedures and make it to the live system. The client’s users pressure the client, the client managers pressure your managers and, guess what, your managers start pressuring you.
You start up the test server and try to reproduce the bug. Alas, everything runs correctly on the test server, so it might be a strange configuration issue or an edge case that causes the problematic behavior. The bottom line is that you cannot track the bug down using your testbed.
What a poor developer should do? Debug the application that runs on the production server. Note that this should be considered as a last resort and when all other attempts to spot the bug have failed. Be sure that the slightest wrong move while on production server (which serves a large number of users) could massively affect the application and cause even bigger problems or a complete service outage.
So, if you decide to take the risky road, read along on how to do it. Some basic guidelines before you get started. First of all, let your client know that you will connect to the production system and “perform some checks”. You don’t have to be specific on what will be done, but certainly don’t do anything without informing the client. Second, pick the time where real traffic is as low as possible. This is a no-brainer, you want as little as possible users to be affected, plus you don’t want to have the server running on heavy load. Third, be careful and try not to be hasty. There might be pressure, but take your time, it will be easier to track down the problem.
I will use JBoss AS and Eclipse in order to provide a hands-on example on how to perform the debugging. We will simulate a running application by deploying a simple piece of code on JBoss and executing a specific method. In most Java based application servers it is just a matter of configuration to start up the JVM with remote debugging enabled. Then, you use your favorite IDE, in my case Eclipse, to attach a debugger on the server’s port and start debugging. Note that enabling the remote debugging brings a small performance penalty, but I usually prefer to have the debugging option enabled so that I can connect to the server at will. In a different case, a JVM restart, thus a server restart, would be required in order to apply the new settings.
First, let’s create the code that will perform the debugging on. We will use a Java MBean which gets deployed on JBoss and has a predefined lifecycle. MBeans are managed beans, Java objects that represent resources to be managed. JBoss actually provides an implementation of an MBean Server, thus MBeans can be deployed on it.
The simplest way is to extend the ServiceMBeanSupport abstract class and implement a service that conforms to the ServiceMBean interface. First we create an Eclipse project named “SimpleMBeanProject”. Then we create an interface that our service will have to implement. The source code is:
package com.javacodegeeks.jboss;

import org.jboss.system.ServiceMBean;

public interface SimpleServiceMBean extends ServiceMBean {

    void start() throws Exception;

    void stop();

    String getName();

    void execute(String input);

}
Then we create the appropriate implementation class:
package com.javacodegeeks.jboss;

import org.jboss.system.ServiceMBeanSupport;

public class SimpleService extends ServiceMBeanSupport implements SimpleServiceMBean {

    @Override
    public void start() throws Exception {
        System.out.println("Starting SimpleService MBean");
    }

    @Override
    public void stop() {
        System.out.println("Stopping SimpleService MBean");
    }

    @Override
    public String getName() {
        return SimpleService.class.getCanonicalName();
    }

    public void execute(String input) {
        System.out.println("Executing with input " + input);
    }

}
The code is really simplistic but with enough functionality for our demonstration purposes. The “execute” method is the one that will be invoked in order to emulate a running application.
A way to deploy the MBean is via bundling the two classes into a Service Archive (SAR) file. This file is a zipped file that includes the MBean classes and the corresponding deployment descriptor, which in this case is a file named “jboss-service.xml” with the following contents:
<?xml version="1.0" encoding="UTF-8"?>

<service>

  <mbean code="com.javacodegeeks.jboss.SimpleService"
     name="javacodegeeks:name=SimpleService">
  </mbean>

</service>
The “jboss-service.xml” file must reside inside a folder named “META-INF” inside the SAR bundle. Then the archive has to be placed inside the <jboss-base-dir>/server/default/deploy directory in order to deploy the MBean. The archive can be created by hand, it is just a zipped file after all, but a more elegant way is to create an ANT script that will automate the procedure.
<?xml version="1.0" encoding="UTF-8"?>

<project name="SimpleService Project Build" default="build-sar">

    <target name="init">
        <property name="base.dir" value="."/>
        <property name="lib.dir" value="${base.dir}/lib"/>
        <property name="bin.dir" value="${base.dir}/bin"/>
        <property name="src.dir" value="${base.dir}/src" />
        <property name="dist.dir" value="${base.dir}/dist" />
        <delete dir="${dist.dir}"/>
        <mkdir dir="${dist.dir}"/>
    </target>

    <target name="compile" depends="init">
        <echo message="Compiling source files..." />
        <javac destdir="${bin.dir}" debug="on">
            <src path="${src.dir}" />
            <classpath>
                <fileset dir="${lib.dir}">
                    <include name="**/*.jar" />
                </fileset>
            </classpath>
            <include name="**/*.java" />
        </javac>
    </target>

    <target name="build-sar" depends="compile">
        <jar destfile="dist/SimpleService.sar">
            <zipfileset dir="bin">
                <include name="com/javacodegeeks/**/*.class" />
            </zipfileset>
            <zipfileset dir="resources" prefix="META-INF">
                <include name="jboss-service.xml" />
            </zipfileset>
        </jar>
    </target>

</project>
When the SAR gets deployed, the “SimpleService” MBean will appear at the server’s JMX Console. This is a web interface that can be accessed at the following URL (replace the host accordingly):
http://host:8080/jmx-console
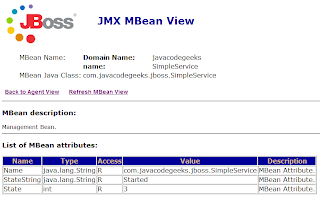
Scroll down until you find the “name=SimpleService” entry and follow the link. The Mbean’s attributes, along with a list of operations, will appear there.
You can manually invoke the “execute” method with a String argument and the corresponding input will be written to standard output.
Ok, after deploying the SAR, it is time to start the debugging. The first step is to have JBoss’s JVM start with remote socket debugging enabled. This is done via JVM’s arguments of course and in order to configure it, you have to do the following:
Linux platform: Open file /bin/run.conf and uncomment the line (remove the “#”) that reads
JAVA_OPTS=”$JAVA_OPTS -Xrunjdwp:transport=dt_socket,address=8787,server=y,suspend=n”
Windows platform: Open file /bin/run.bat and uncomment the line (remove the “rem” keyword)
set JAVA_OPTS=-Xdebug -Xrunjdwp:transport=dt_socket,address=8787,server=y,suspend=n %JAVA_OPTS%
The port that will be used is 8787. Make sure that “suspend” parameter is set to “n” (disabled) or, in a different case, when the server starts for the first time it will halt and wait for a remote debugger to be attached before proceeding.
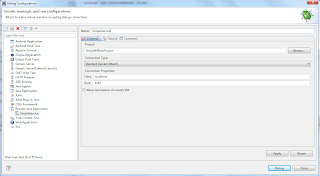
After that, start the server normally. It is now time to connect to the server via Eclipse. Go to “Run ? Debug Configurations…” and then double-click on the “Remote Java Application” option. At the “Connect” tab make sure that the “SimpleMBeanProject” is selected, provide the remote “Host” IP address or hostname (“localhost” in my case) and the “Port” that the server listens at for incoming debugging sessions (8787 as configured previously). Finally, make sure that the “Allow termination of remote VM” is NOT selected, because if it is, the server’s JVM will shutdown the moment you disconnect the debugging. Not really a nice thing to happen to a production server. Ok, hit the “Debug” button to proceed.
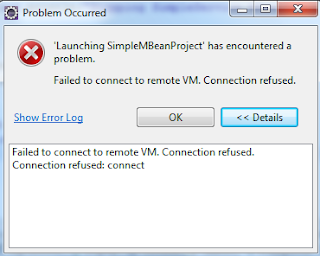
If the remote debugging is not enabled or if there is a connection problem (perhaps a firewall issue) you will see the following image:
But if everything works correctly, the Eclipse debugger will attach itself to the server and you should be able to see something like this:
As you can see, the monitored threads appear in the “Debug” view. If that view does not appear, go to “Window ? Show View ? Other…” and search it under the “Debug” category.
Now let’s assume that the “execute” method of the “SimpleService” class simulates the code that gets executed on the production server with every incoming request. If you were performing debugging on a test server all you had to do is add a breakpoint inside the method, trigger a request and proceed with the debugging. However something like that will definitely not work on a production server. The moment you toggle a breakpoint, all requests will suspend and wait for your action (if the execution path passes from that method of course). That will stop the requests execution and most probably will get noticed by the users. Furthermore, you will be overwhelmed by the magnitude of the requests that you will have to monitor at the same time.
What you have to do is add a conditional breakpoint that will only halt when specific input is provided, i.e. the one that you provide. So, disconnect from the remote server and then add a breakpoint inside the “execute” method (at line 23). Then, right click on the breakpoint and from the menu that appears, choose “Breakpoint Properties” (the last one).
The properties menu will come up. Check the “Enable Condition” checkbox and inside the textarea, write a condition. The breakpoint will be valid and suspend the execution only when that condition is true. Note that you actually write Java code inside the textarea and that you can use the familiar code assistance for that (using Ctrl+Space). Isn’t Eclipse an incredible tool? We want the breakpoint to kick in only when the method’s argument is “myinput”.
Start the remote debugging again and now you are sure that the execution will be suspended when your very own input is provided. To demonstrate this return to the JMX console and the “SimpleService” MBean view. At the “execute” method, use a random argument:
Hit the “Invoke” button and notice that the execution is not suspended by Eclipse. Now, use “myinput” as the input value, hit “Invoke” and notice that Eclipse captures the execution.
Now you are ready to proceed with the well known debugging options (step into methods, watch variable values etc.) without worrying that the system’s users will be affected.
You can download the Eclipse project here.
Happy bug hunting!
- JBoss 4.2.x Spring 3 JPA Hibernate Tutorial
- GWT EJB3 Maven JBoss 5.1 integration tutorial
- ‘Hello World’ portlet on JBoss Portal


