Java performance tuning survey results (part IV)
This is the last post in series where we analyze the results of the Java Performance Tuning Survey we conducted in October 2014. If you have not read the first posts, I recommend to go through the following first:
- Frequency and severity of performance problems
- Most popular monitoring solutions
- Tools and techniques used to find the root cause
This post is opening up some interesting correlations found in the data and summarizing the results.
Reproducing is a key to quick success
When you are in charge of solving a performance issue, you need evidence to find the root cause. To get the evidence, you often need to reproduce the issue. In survey, we asked the respondents whether they were able to reproduce the issue:
- 9% did not need to reproduce, having enough evidence already
- 27% were unable to reproduce the issue
- 64% managed to reproduce the issue
In another question we asked “How long does it take to find and fix the issue you were facing”. On average, this took 80 hours. We analyzed, whether to the 27% who were not able to reproduce the issue were struggling more. Results were clear:
- If the respondent was able to reproduce the issue, then on average it took 65 hours
- If respondent was unable to reproduce the issue, it took 113 hours, or 74% more time to find the root cause and fix it.
The difference is clearly visible. The cause for the difference is hidden inside the troubleshooting process. To fix an issue, you need evidence, typically gathered from various sources, such as log files, thread dumps or heap dumps. But you can only get the evidence if you are able to reproduce the case, preferably at will. If you cannot reproduce the problem, you are left without evidence and the only tool in your arsenal tends to be the good old trial and error. Facing a 100,000+ lines of code, you are doomed to face a lot of failed trials along the way.
Some issues are tougher than others.
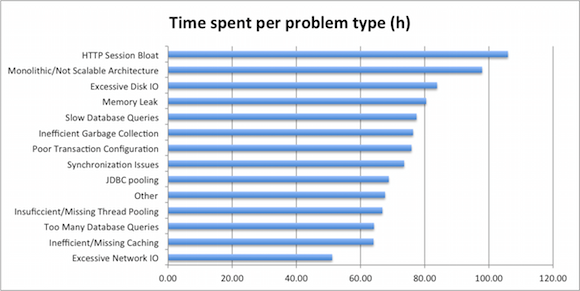
Respondents also gave us the underlying root cause for the performance issue they were solving. We looked into the different issues in order to understand whether some of the issues are harder to solve than others
Let us again recall that average time to find and fix the issues was 80 hours. When categorizing by the issue type, we found the following:
- The easiest issues to find and fix are related to network IO: with 51 hours spent on average.
- Memory leaks rank exactly average by the time spent: on average it takes 80 hours and 24 minutes to spot and fix one.
- On the other end of the spectrum are architectural issues – when the underlying cause were related to monolithic architecture and HTTP session bloat, where it took 98 and 105 hours correspondingly. This is around to 100% more time to find and fix the cause.
Looking at the extremes, it should not actually be surprising. When your architecture is causing performance issues, then the fix itself tends to be complex and time-consuming, thus requiring more time to fix. And when you tend to abuse the network, it often boils down to a single malicious call, which you can rather easily isolate and fix.
Random tools to help
Next, we analyzed the tools and techniques used to troubleshoot certain underlying root causes. We noticed that on average, users try out no more, no less than four different tools to gather evidence and find the root cause. Most popular tools and techniques involved log analysis, heap/thread dumps and profilers.
When we looked the usage of tools across different underlying problems, we became truly surprised. There was very little correlation in between the underlying problem and tools used to troubleshoot – the same tooling was listed with the same frequency independent of the problem at hand.
The best example for this could be thread dump analysis. This is a good way to gather evidence about concurrency issues. Indeed, 52% of the respondents solving a concurrency issue used thread dump analysis as one of the root cause analysis sources. But for example, when the problem at hand was a memory leak, then the very same thread dump analysis was listed on 42% of the occasions.
Or when looking from the tooling perspective – independent of the problem type, 41-53% of the respondents used profiler to gather evidence, independent of the symptoms and underlying problem.
It is tricky to draw a conclusion from this data, but it appears that the evidence gathering and analysis process is very informal and involves using the tools and techniques this particular person has used or has heard of before.
Conclusions
This survey was conducted to steer further Plumbr development. Main conclusion for us is built upon four key outcomes of the survey:
- Average time to find and fix a performance issue is 80 hours
- For 76% of the cases, most of this time is spent in the vicious “trying to reproduce – gathering evidence – interpreting evidence” cycle.
- Reproducing is impossible for 27% of the cases. In such cases, finding and fixing the issue took 73% more time.
- Evidence gathering process is completely informal and involves on average four randomly chosen tools
We promise to take it from here and offer a solution to the issues listed above. Using Plumbr to monitoring your systems pinpoints you to actual underlying root cause immediately, completely skipping the “trying to reproduce – gathering evidence – interpreting evidence” cycle:
Our current offering allows this for thread locks, inefficient GC and memory leaks, but we keep expanding our offering, so that you will have a safety net in place for all the performance issues affecting your JVM.
| Reference: | Java performance tuning survey results (part IV) from our JCG partner Ivo Mägi at the Plumbr Blog blog. |


