Java Flight Recorder (JFR)
JFR is a Java profiler which will allow you to investigate the runtime characteristics of your code. Typically you will use a profiler to determine which parts of your code are causing large amounts of memory allocation or causing excess CPU to be consumed.
There are plenty of products out there. In the past I’ve used YourKit, OptimizeIt, JProfiler, NetBeans and others. Each has its benefits and it is largely a matter of personal preference as to which you choose. My current personal favourite is YourKit. It integrates nicely into IntelliJ has a relatively low overhead and presents its reports well.
The truth is that profiling is a very inexact science and it is often worth looking at more than one profiler to build up a clearer picture of what exactly is going on in your program. To my knowledge most of the profilers rely on the JVMP/JVMTI agents to probe the Java program. A major problem with this is safe points. This means your Java program can only be probed when it is at a safe point. This means that you will get a false picture of what is really going on in your program especially if much of the activity is between safe points. Also all profilers, to a varying degree add overhead. Profiler overhead will change the characteristics of your program and may cause misleading results from your analysis. Much more information here.
Enter JFR. JRF has been bundled with the JDK since release 7u40. JFR is built with direct access to the JVM. This not only means that there is a very low overhead (claimed to be less than 1% in nearly all cases) but also does not rely on safe points. Have a look here at an example of how radically different an analysis from YourKit and JFR can look.
To run JFR you need to add these switches to your Java command line:
-XX:+UnlockCommercialFeatures -XX:+FlightRecorder
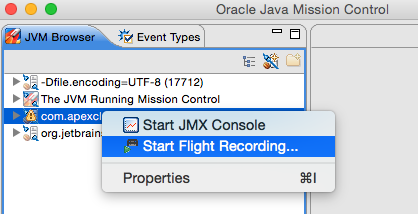
JFR is located in Java Mission Control (JMC). To launch JMC just type jmc in your command line and if you have the JDK in your path the JMC console will launch. You should see your Java program in the left hand pane. Right click on your program and then start flight recording.
You will be presented with a dialog box where you can just accept the defaults (sample for a minute) and then your results will be displayed. It’s worth paying around with the options to find how this will work best for you. As with all good products this GUI is fairly intuitive.
As you can tell from the command line switches it is commercial feature. I’m not exactly sure what that means but you can read more about that in the documentation here. Also you can run this from the command line, it’s all in the documentation.
One problem I did find was when I downloaded the latest Java8 snapshot (at this time 1.8.0_40-ea) I was unable to launch my program and got the following message:
/Library/Java/JavaVirtualMachines/jdk1.8.0_40.jdk/Contents/Home/bin/
Error: Trying to use 'UnlockCommercialFeatures', but commercial features are not available in this VM.
Error: Could not create the Java Virtual Machine.
Error: A fatal exception has occurred. Program will exit.
In summary, JFR is a great addition to any developers toolkit and as long as you are using JDK release 7u40 or above it’s certainly worth trying it out on your code.
(I encourage you to have a look at a previous post First rule of performance optimisation in conjunction with JFR)
| Reference: | Java Flight Recorder (JFR) from our JCG partner Daniel Shaya at the Rational Java blog. |


Can I refer a follow up article on this subject that I wrote:
http://www.rationaljava.com/2015/03/java-flight-recorder-since-jdk-18040.html
Daniel Shaya
Can I make java profiler with help of code?