RESTful Charts with JAX-RS and PrimeFaces
Oftentimes, it is useful to utilize a chart for providing a visual representation of your data. PrimeFaces supplies charting solutions that make it easy to add visual representations of your data into web and mobile applications. If we couple the use of PrimeFaces charting components with RESTful web service data, we can create custom charts that scale well for both desktop and mobile devices.
In this post, I will update the Java EE 7 Hands On Lab MoviePlex application to provide a dashboard into which we can integrate PrimeFaces chart components. We’ll create one chart in this example, but you can utilize this post to help you build even more charts in a similar manner. Specifically, we will utilize a RESTful web service to glean movie theater capacity information, and we’ll display each of the theater capacities using a PrimeFaces Bar Chart.
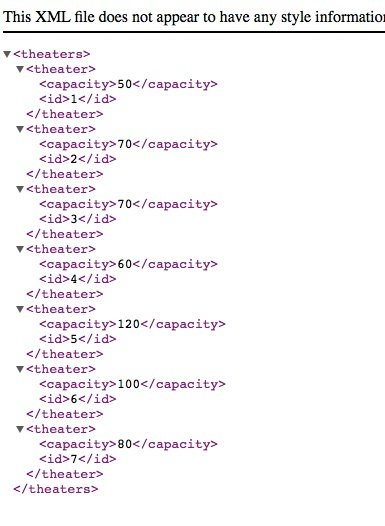
To begin, download the Java EE 7 Hands On Lab application solution archive, if you have not already done so. From there, open it up within NetBeans IDE. To create this post, I am using NetBeans 8.0.2. Once the project has been imported into NetBeans, deploy it to your application server (GlassFish 4.1 in my case) by right-clicking on the project and choosing Run. Once deployment is complete, open the theater web service within a browser by opening the following URL: http://localhost:8080/ExploringJavaEE7/webresources/theater/. The web service should produce a listing that looks similar to that in Figure 1.

We will utilize the data from this web service to feed our dashboard widget. Let’s first create the backend code, and then we will tackle the UI. First, create a new package named org.glassfish.movieplex7.jsf, by right-clicking on Source Packages, and selecting “New…”-> “Java Packages”. Next, create a JSF Managed Bean controller by right-clicking on that package, and selecting “New…”-> “JSF Managed Bean”, and name it DashboardController. Let’s annotate the controller as @SessionScoped, and then implement java.io.Serializable. In this controller, we will obtain the data, and construct the model for the dashboard. We will first query the web service utilizing a JAX-RS client, and we will utilize the data to populate list of Theater objects. Therefore, we need to define the following four fields to begin:
Client jaxRsClient;
// Typically not hard coded...store in a properties file or database
String baseUri = "http://localhost:8080/ExploringJavaEE7/webresources/theater/";

private List<Theater> theaterList;
private BarChartModel theaterCapacityModel;
The Client is of type javax.ws.rs.client.Client, and we will initialize the field within the class constructor by calling upon the javax.ws.rs.client.ClientBuilder, as follows:
public DashboardController() {
    jaxRsClient = ClientBuilder.newClient();
}
Next up, we need to create a method to load the data, create, and configure the model. In our controller, the init() method basically contains an implementation of delegating tasks to other methods. The init() method implementation invokes two methods: loadData(), and createTheaterCapacityModel().
public void init() {
    loadData();

    createTheaterCapacityModel();
}
The code is written such that it will be easy to add more widgets to our dashboard at a later date, if desired. The loadData() method provides the implementation for loading the data from our web service into our local list.
private void loadData() {

    theaterList = jaxRsClient.target(baseUri)
            .request("application/xml")
            .get(new GenericType>() {
            }
            );

}
If we had more widgets, then we would add the data loading code for those data models into this method as well. Next, we need to initialize the org.primefaces.model.chart.BarChartModel that we had defined, and load it with the data from the web service. The initTheaterCapacityModel() method contains the implementation for creating the BarChartModel, and populating it with one or more ChartSeries objects to build the data.
public BarChartModel initTheaterCapacityModel() {

    BarChartModel model = new BarChartModel();

    ChartSeries theaterCapacity = new ChartSeries();
    theaterCapacity.setLabel("Capacities");


    for (Theater theater : theaterList) {

        theaterCapacity.set(theater.getId(), theater.getCapacity());

    }
    model.addSeries(theaterCapacity);

    return model;
}
As you can see, this model consists of a single org.primefaces.model.chart.ChartSeries object. Actually, the model can contain more than a single ChartSeries object, and different colored bars will be used to display that data within the chart. In this case, we simply add the theater ID and the capacity for each Theater object to the ChartSeries object, and then we add that to the BarChartModel. The createTheaterCapacityModel() method is invoked within our init() method, and in it we call upon the initTheaterCapacityModel() method for creation of the org.primefaces.model.chart.BarChartModel, and then configure it accordingly.
private void createTheaterCapacityModel() {
    theaterCapacityModel = initTheaterCapacityModel();

    theaterCapacityModel.setTitle("Theater Capacity");
    theaterCapacityModel.setLegendPosition("ne");
    theaterCapacityModel.setBarPadding(3);
    theaterCapacityModel.setShadow(false);

    Axis xAxis = theaterCapacityModel.getAxis(AxisType.X);
    xAxis.setLabel("Theater");

    Axis yAxis = theaterCapacityModel.getAxis(AxisType.Y);
    yAxis.setLabel("Capacity");
    yAxis.setMin(0);
    yAxis.setMax(200);

}
As you can see, inside of the method, we initialize the model by calling upon initTheaterCapacityModel(), and then we configure it via a series of “set” methods. Specifically, we set the title, position, and provide some visual configurations. Next, set up the axis by calling upon the model’s getAxis() method, and passing the X and Y axis constants. We then configure each axis to our liking by setting a label and min/max values for the Y axis. See the full sources for the class at the end of this post.
That does it for the server-side code, now let’s take a look at the UI code that is used to display the chart component. Begin by generating a new XHTML file at the root of the Web Pages folder in your project by right-clicking and choosing "New..."-> "XHTML...", and name the file dashboard.xhtml. The sources for dashboard.xhtml should contain the following:
<html xmlns:f="http://xmlns.jcp.org/jsf/core" xmlns:h="http://xmlns.jcp.org/jsf/html" xmlns:p="http://primefaces.org/ui" xmlns="http://www.w3.org/1999/xhtml">
    <h:head>


        <title>Theater Dashboard</title>

    </h:head>
    <h:body>
        <f:event listener="#{dashboardController.initView}" type="preRenderView"/>
        <h:form id="theaterDash" prependid="false">
            <p:growl id="growl" showdetail="true"/>
            <p:layout fullpage="true">
                <p:layoutUnit position="center">

                            <p:panel header="Capacity for Theaters" id="theater_capacity" style="border: 0px;">
                                <p:chart model="#{dashboardController.theaterCapacityModel}" style="border: 0px; height: 200px; width: 500px;" type="bar">
                            </p:chart></p:panel>


                </p:layoutUnit>
            </p:layout>

            <p:poll interval="60" listener="#{dashboardController.pollData}"/>

        </h:form>

    </h:body>
</html>
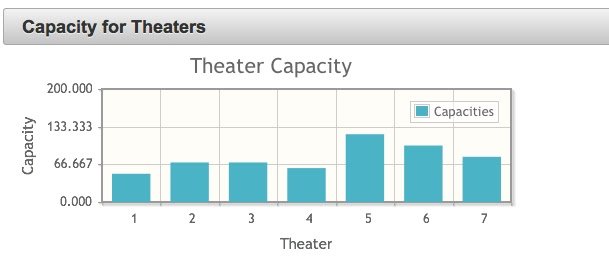
Fairly simplistic, the JSF view contains a PrimeFaces layout, including a panel and a chart. Near the top of the view, an f:event tag is used to invoke the listener method which is implemented within the DashboardController class, identified by initView(). For the purposes of this example, the p:chart tag is where the magic happens. The chart type in this case is set to “bar”, although other options are available (visit http://www.primefaces.org/showcase). The model is set to #{dashboardController.theaterCapacityModel}, which we defined, populated, and configured within the controller class. We then provide a width and a height to make the chart display nicely. In case the data changes (I know theaters do not increase or decrease in size often, but go with me here), we added a PrimeFaces poll component invoke the pollData() method, which refreshes the data periodically. In this case, the data will be refreshed every 60 seconds. When complete, the chart should look like that in Figure 2.

The chart is interactive, and if you click on the label, the bars will become hidden. This is handy if you have more than one category (via the ChartSeries). You can even include a p:ajax tag within the chart component, and invoke an action when the chart is clicked on…perhaps a dialog will pop up to display some additional data on the item which is clicked. That does it…now you can create even more charts utilizing PrimeFaces and RESTful web services. I suggest building upon the MoviePlex application to see what other possibilities can be had. Full Sources for the DashboardController class:
package org.glassfish.movieplex7.jsf;

import java.util.List;
import javax.inject.Named;
import javax.enterprise.context.SessionScoped;
import javax.faces.component.UIComponent;
import javax.faces.component.UIViewRoot;
import javax.faces.context.FacesContext;
import javax.ws.rs.client.Client;
import javax.ws.rs.client.ClientBuilder;
import javax.ws.rs.core.GenericType;
import org.glassfish.movieplex7.entities.Theater;

import org.primefaces.model.chart.Axis;
import org.primefaces.model.chart.AxisType;
import org.primefaces.model.chart.BarChartModel;
import org.primefaces.model.chart.ChartSeries;

/**
 *
 * @author Juneau
 */
@Named(value = "dashboardController")
@SessionScoped
public class DashboardController implements java.io.Serializable {

    Client jaxRsClient;
    // Typically not hard coded...store in a properties file or database
    String baseUri = "http://localhost:8080/ExploringJavaEE7/webresources/theater/";

    private List theaterList;

    private BarChartModel theaterCapacityModel;


    /**
     * Creates a new instance of FamisEquipPmChartController
     */
    public DashboardController() {
        jaxRsClient = ClientBuilder.newClient();
    }

    public void init() {
        loadData();

        createTheaterCapacityModel();
    }

    /**
     * Initializes the view on page render...if we wish to grab a reference
     * to a panel, etc.
     */
    public void initView(){
        UIViewRoot viewRoot =  FacesContext.getCurrentInstance().getViewRoot();
        // Do something
    }

    public void pollData() {
        System.out.println("polling data...");
        loadData();
    }

    /**
     * JAX-RS client to poll the data
     */
    private void loadData() {

        theaterList = jaxRsClient.target(baseUri)
                .request("application/xml")
                .get(new GenericType>() {
                }
                );

    }


    /**
     * Initialize the Bar Chart Model for Displaying PM Estimated Hours by Month
     *
     * @return
     */
    public BarChartModel initTheaterCapacityModel() {

        BarChartModel model = new BarChartModel();

        ChartSeries theaterCapacity = new ChartSeries();
        theaterCapacity.setLabel("Capacities");


        for (Theater theater : theaterList) {

            theaterCapacity.set(theater.getId(), theater.getCapacity());

        }
        model.addSeries(theaterCapacity);

        return model;
    }


    private void createTheaterCapacityModel() {
        theaterCapacityModel = initTheaterCapacityModel();

        theaterCapacityModel.setTitle("Theater Capacity");
        theaterCapacityModel.setLegendPosition("ne");
        theaterCapacityModel.setBarPadding(3);
        theaterCapacityModel.setShadow(false);

        Axis xAxis = theaterCapacityModel.getAxis(AxisType.X);
        xAxis.setLabel("Theater");

        Axis yAxis = theaterCapacityModel.getAxis(AxisType.Y);
        yAxis.setLabel("Capacity");
        yAxis.setMin(0);
        yAxis.setMax(200);

    }

    /**
     * @return the theaterCapacityModel
     */
    public BarChartModel getTheaterCapacityModel() {
        return theaterCapacityModel;
    }

    /**
     * @param theaterCapacityModel the theaterCapacityModel to set
     */
   public void setTheaterCapacityModel(BarChartModel theaterCapacityModel) {
        this.theaterCapacityModel = theaterCapacityModel;
    }


}| Reference: | RESTful Charts with JAX-RS and PrimeFaces from our JCG partner Josh Juneau at the Josh’s Dev Blog – Java, Java EE, Jython, Oracle, and More… blog. |


