Revisiting the First Rule of Performance Optimisation: Effects of Escape Analysis
In an earlier post I wrote about how to start optimising for performance. If you haven’t read the post I would advise you do have a look but the long and short of it is that it’s pretty much always worth reducing allocations as a first step to improving performance. But understanding exactly where your program actually allocates is not as easy as you might think…
Whilst reviewing an article on a similar topic it occurred to me that it would be interesting to try and measure exactly how much longer it takes to allocate as opposed to reuse an existing object. We know that allocation is really fast in Java (ignore the side effects of object allocation for now) so let’s see how allocation compares to object re-use.
This is the first attempt at the code I wrote to try and measure that change:
package util;

public class Allocation1 {
    static int iterations = 10_000_000;

    public static void main(String[] args) {
        for (int i = 0; i <3 ; i++) {
            testNoAllocations();
            testAllocations();
        }
    }

    private static void testNoAllocations() {
        long result = 0;
        long time = System.currentTimeMillis();
        TestObject to = new TestObject(0, 0);
        for (int i = 0; i < iterations; i++) {
            to.setI(5);
            to.setJ(5);
            result += to.getResult();
        }


        System.out.println("No allocation took "
                + (System.currentTimeMillis() - time)
                + " with result " + result);
    }

    private static void testAllocations() {
        long time = System.currentTimeMillis();
        long result = 0;

        for (int i = 0; i < iterations; i++) {
            result += new TestObject(5, 5).getResult();
        }

        System.out.println("Allocations took "
                + (System.currentTimeMillis() - time)
                + " with result " + result);
    }

    private static class TestObject {
        int i, j;

        public TestObject(int i, int j) {
            this.i = i;
            this.j = j;
        }

        public int getI() {
            return i;
        }

        public void setI(int i) {
            this.i = i;
        }

        public int getJ() {
            return j;
        }

        public void setJ(int j) {
            this.j = j;
        }

        public int getResult() {
            return i + j;
        }
    }
}
The output form the program was as below:
No allocation took 15 with result 100000000
Allocations took 11 with result 100000000
No allocation took 12 with result 100000000
Allocations took 13 with result 100000000
No allocation took 0 with result 100000000
Allocations took 1 with result 100000000
Hardly anything in it – but then I got suspicious….
Was the testAllocations method actually allocating or was escape analysis being applied? Escape analysis allows the JIT to bypass the object allocation and use the stack instead of the heap. See here for more details.
Well one way to find out is to run the program with the command line setting -verbosegc and see if the gc was being invoked. As I suspected there was no gc, which, given the fact I had not set the -Xms and -Xmx flags should not have been possible.
So I wrote another little program forcing the testAllocate method to ‘escape’ and thereby allocate:
package util;


public class Allocation2 {
    static int iterations = 10_000_000;

    public static void main(String[] args) {
        for (int i = 0; i <3 ; i++) {
            testNoAllocations();
            testAllocations();
        }
    }

    private static void testNoAllocations() {
        long result = 0;
        long time = System.currentTimeMillis();
        TestObject to = new TestObject(0, 0);
        TestObject[] tarr = new TestObject[iterations];
        for (int i = 0; i < iterations; i++) {
            to.setI(5);
            to.setJ(5);
            tarr[i] = to;
            result += to.getResult();
        }


        System.out.println("No allocation took "
                + (System.currentTimeMillis() - time)
                + " with result " + result);
    }

    private static void testAllocations() {
        long result = 0;
        long time = System.currentTimeMillis();

        TestObject[] tarr = new TestObject[iterations];

        for (int i = 0; i < iterations; i++) {
            tarr[i] = new TestObject(5, 5);
            result += tarr[i].getResult();
        }

        System.out.println("Allocations took "
                + (System.currentTimeMillis() - time)
                + " with result " + result);
    }

    private static class TestObject {
        int i, j;

        public TestObject(int i, int j) {
            this.i = i;
            this.j = j;
        }

        public int getI() {
            return i;
        }

        public void setI(int i) {
            this.i = i;
        }

        public int getJ() {
            return j;
        }

        public void setJ(int j) {
            this.j = j;
        }

        public int getResult() {
            return i + j;
        }
    }
}
The output for this was very different, see below:
I’ve run with -verbose:gc – I’ve picked out the System.out in red so that the times can be easily identified.
*** No allocation took 43 with result 100000000
[GC (Allocation Failure)  111405K->108693K(142336K), 0.1243020 secs]
[Full GC (Ergonomics)  108693K->69499K(190976K), 0.3276730 secs]
[GC (Allocation Failure)  102779K->102923K(204288K), 0.1275237 secs]
[GC (Allocation Failure)  149515K->149731K(224256K), 0.2172119 secs]
[Full GC (Ergonomics)  149731K->149326K(359936K), 1.1698787 secs]
[GC (Allocation Failure)  215886K->215502K(365056K), 0.2680804 secs]
 **** Allocations took 2321 with result 100000000
*** No allocation took 37 with result 100000000
[Full GC (Ergonomics)  365307K->52521K(314368K), 0.1279458 secs]
[GC (Allocation Failure)  124201K->124497K(314368K), 0.2493061 secs]
[GC (Allocation Failure)  196177K->196401K(419840K), 0.3004662 secs]
 **** Allocations took 733 with result 100000000
[GC (Allocation Failure)  276094K->274825K(429056K), 0.5655052 secs]
[Full GC (Ergonomics)  274825K->1024K(427520K), 0.0042224 secs]
*** No allocation took 583 with result 100000000
[GC (Allocation Failure)  98304K->59382K(527872K), 0.0727687 secs]
[GC (Allocation Failure)  224246K->224582K(534016K), 0.1465164 secs]
 **** Allocations took 263 with result 100000000
*** No allocation took 15 with result 100000000
[GC (Allocation Failure)  389446K->167046K(643584K), 0.0831585 secs]
 **** Allocations took 119 with result 100000000
[GC (Allocation Failure)  366101K->91504K(653312K), 0.0006495 secs]
*** No allocation took 15 with result 100000000
[GC (Allocation Failure)  329072K->290206K(681472K), 0.1650293 secs]
 **** Allocations took 202 with result 100000000
As you can see this time the program is definitely allocating and the time for the allocated test is considerably slower.
Let’s see if we can eliminate the need for GC pauses by setting a high -Xms value.
This time the GC is almost eliminated and we get these results:
*** No allocation took 48 with result 100000000
 **** Allocations took 162 with result 100000000
*** No allocation took 44 with result 100000000
 **** Allocations took 172 with result 100000000
*** No allocation took 28 with result 100000000
 **** Allocations took 179 with result 100000000
*** No allocation took 40 with result 100000000
 **** Allocations took 365 with result 100000000
*** No allocation took 73 with result 100000000
[GC (Allocation Failure)  1572864K->188862K(6029312K), 0.2602120 secs]
 **** Allocations took 499 with result 100000000
*** No allocation took 43 with result 100000000
 **** Allocations took 62 with result 100000000
*** No allocation took 17 with result 100000000
 **** Allocations took 228 with result 100000000
*** No allocation took 95 with result 100000000
 **** Allocations took 364 with result 100000000
*** No allocation took 46 with result 100000000
 **** Allocations took 194 with result 100000000
*** No allocation took 14 with result 100000000
[GC (Allocation Failure)  1761726K->199238K(6029312K), 0.2232670 secs]

 **** Allocations took 282 with result 100000000
So even without GC, allocating is considerably slower.
The next step was to examine what was happening by looking at my programs with a profiler.
I ran the first program, Allocation1, with my favourite profiler, YourKit and started seeing very different behaviour. The program which we had previously shown not be allocating, was now allocating (I could see this my running with verbose GC below).
This is the output:
[YourKit Java Profiler 2014 build 14114] Log file: /Users/daniel/.yjp/log/Allocation1-11980.log
No allocation took 20 with result 100000000
[GC (Allocation Failure)  33280K->1320K(125952K), 0.0032859 secs]
[GC (Allocation Failure)  34600K->1232K(125952K), 0.0028476 secs]
[GC (Allocation Failure)  34512K->1136K(125952K), 0.0020955 secs]
[GC (Allocation Failure)  34416K->1168K(159232K), 0.0024346 secs]
[GC (Allocation Failure)  67728K->1240K(159232K), 0.0021334 secs]
Allocations took 109 with result 100000000
No allocation took 26 with result 100000000
[GC (Allocation Failure)  67800K->1376K(222208K), 0.0036706 secs]
[GC (Allocation Failure)  134496K->1508K(222208K), 0.0024567 secs]
Allocations took 98 with result 100000000
No allocation took 1 with result 100000000
[GC (Allocation Failure)  134628K->1516K(355840K), 0.0008581 secs]

Allocations took 56 with result 100000000
And in YourKit we see the creation of those objects:
Running with YourKit had interfered with the escape analysis and caused the objects to be allocated!!
The advice I gave in my previous post ‘First Rule of Performance Optimisation‘ was to look to eliminate allocation. This program (Allocation1) looks (from YourKit’s view) like it is allocating and a developer, following my advice, might spend considerable effort reducing that allocation. The developer would be surprised and disappointed when they found that on rerunning the program (without YourKit) that nothing at all had been achieved. Of course now we know why that is, allocation were only a side-effect of running the profiler! Without the profiler the allocations were being ‘escaped-anaysised’ away.
So how are we to know whether allocations we see in the profiler are real or just caused by the profiler interfering with escape analysis.
The answer is to use Flight Recorder. See my previous post on the differences between Flight Recorder and other profilers.
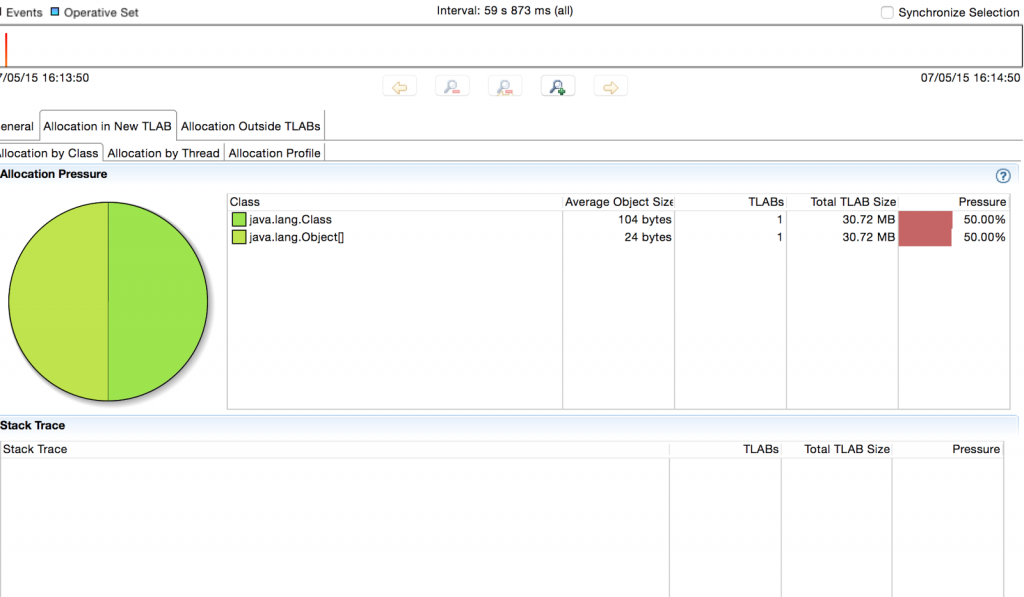
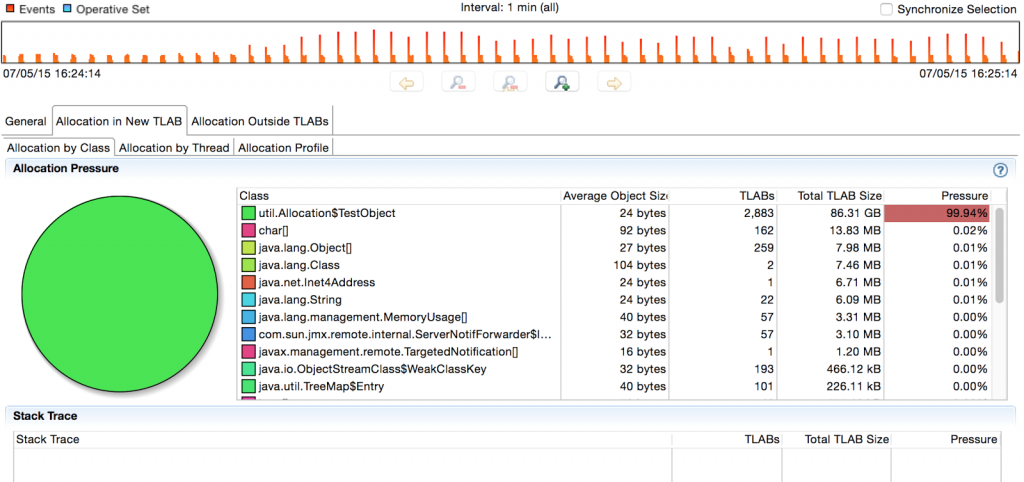
This is the Flight Recording when we run Allocation1.
As you can see no allocations have been recorded. Contrast this with the Flight Recording we get from running Allocation2.
Conclusions
- It is always better not to allocate objects
- But escape analysis means that calling new does not always lead to an allocation!
- In general, profilers interfere with escape analysis so be careful of fixing an allocation that, without the profiler might be escaped away.
- Using Flight Recorder should not interfere with escape analysis and give you a more accurate reflection as to your real allocation.
Further Reading on the subject:
I subsequently came across this excellent (as usual) post from Nitsan Wakart: http://psy-lob-saw.blogspot.co.uk/2014/12/the-escape-of-arraylistiterator.html
| Reference: | Revisiting the First Rule of Performance Optimisation: Effects of Escape Analysis from our JCG partner Daniel Shaya at the Rational Java blog. |


Benchmarking stuff like this is not a easy topic, as Aleksey Shipilëv explains thoroughly in his blog. Go and read about those stuff, perhaps take a look at JMH, because relying on solely on system.nanoTime for benchmarking is not wise. To quote : “System.nanoTime is as bad as String.intern now: you can use it, but use it wisely. The latency, granularity, and scalability effects introduced by timers may and will affect your measurements if done without proper rigor. This is one of the many reasons why System.nanoTime should be abstracted from the users by benchmarking frameworks, monitoring tools, profilers, and… Read more »
Appreciate your feedback – although I prefer comments on my site.
If you look through my blog you will see a number of articles about why and how to use JMH.
http://www.rationaljava.com/2015/02/jmh-how-to-setup-and-run-jmh-benchmark.html
The point of this article was not the actual timing but showing showing the effects of escape analysis on allocations.