Who is stealing your memory? The Application Servers Edition
You create an amazing app. You put it into production. And you notice that you justdo not have enough memory available. Even when all your measurements (maybe taken with the help of our small utility) show that you should be just fine.
We are planning to publish a series of blog posts investigating where the heap disappears, and kick off with the infrastructure edition. The hypothesis for today – could my application server be the greedy bastard consuming all my precious memory?To find it out, we ran a small set of tests on five application servers.
Ladies and gentlemen, let us introduce the contestants:
- Oracle Weblogic 12.1.1
- Glassfish 3.1.1.2
- RedHat JBoss AS 7.1.1
- Apache Tomcat 7.0.30
- Jetty 8.1.7
You might say we’d be comparing apples to oranges here – by having full Java EE profiles, such as Weblogic, Glassfish and JBoss, competing with the Web containers like Jetty or Tomcat. But – we have lost count of the cases where we have seen IBM or Oracle deployments running just servlets, so we figured it would be enlightening to see all the mentioned common containers on the same page.
Before we start with the measurements – we’d like to send some personal greetings to the Weblogic team. For zipping their archive without the root folder. I had some fun tracing what the hell had actually been unzipped. Secondly, kudos goes to JBoss. It took me 10 minutes of browsing their website to understand what to download. And the Very Special Thanks goes to IBM. Their WebSphere just cannot be installed on Mac.
But we didn’t plan for this post to turn into a sequel to the excellent Everything Breaks and Nobody is Upset post. So let’s get on with our contest. By now, all our containers have been downloaded and are ready to participate. The test that we ran involved launching all the containers and gathering data after every 1,000 ms. We very much like the scientific approach to such contests, and we are also lazy. This combination resulted in us using another small utility that we built in-house, and delegating all the boring work of collecting the data into a stats file. The data was collected using the JMX API bundled with the JVM itself. The gathered data contained the total memory available for the JVM and the unallocated memory size.
All the containers were started in “out-of-the-box configuration”, we did not alter the configuration in any way besides adding the statistics utility to the server startup scripts. The only exception here was Weblogic, whose PermGen space was trimmed to absolute precision – when we attached our agent consisting of two java classes we ended up with an error message suggesting to increase the PermGen size.
Throughout the tests we didn’t deploy anything on the servers nor used the servers in any way, including the bundled administrator utilities. All the servers had 90 minutes of runtime before we killed all the servers with kill -9 <pid>.
The machine used for carrying out the tests was a 2010 vintage 64-bit Macbook Pro, running OS X Mountain Lion. The JVM used in tests was Oracle HotSpot 1.6.0_35.
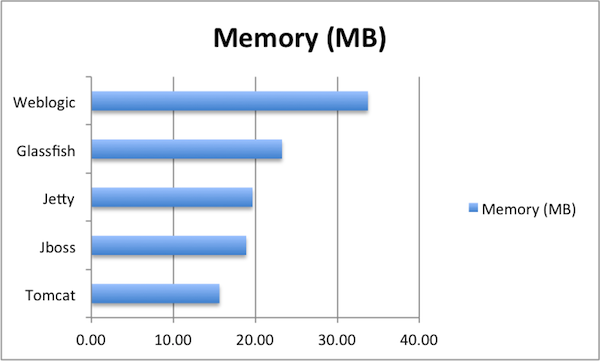
But enough of the background. The results speak for themselves:
From the graph we can see that Tomcat was a clear winner here, being responsible for only 15.63MB consumed. Weblogic required more than double that amount on the other end of the chart, allocating 33.73MB just for itself.
To be honest, we were most surprised to find Jetty only on the 3rd place. The initial betting round carried out inside our team prior to the tests clearly favoured Jetty to have the smallest memory footprint. But no – with it’s 19.66MB, it was only ranked third, between Glassfish and JBoss, which respectively consumed 23.26MB and 18.89MB.
To conclude though – even the clear loser in our competition would most likely not be responsible for your application’s memory problems. Unless you use a very memory constrained environment, of course.
We plan to continue the series by lining up popular frameworks to see how much memory would be lost before you start writing a single line of code in your typical Java EE application. Any frameworks you would like to see in the competition? Let us know by a tweet that includes @JavaPlumbr.
Reference: Who is stealing your memory? The Application Servers Edition from our JCG partner Nikita Salnikov Tarnovski at the Plumbr Blog blog.


I have been naively believing that JBoss AS was a monster eater of Memory and overscored Glassfish; yet when I started benchmarking the AS7, my beliefs started to prove wrong. Glassfish is definitely a Memory swallower depending on how you use it (Web Profile, Full Stack..). And don’t mention Weblogic, even if it is today the way to go for big companies, it’s definitely cubersome and so heavy; I wouldn’t be suprised if it is in the top 6. Some folks would tell you this memory consumption issue is solved by Load Balancing. Some others would say, it only is… Read more »
Several problems in this article, starting with Jetty. The reason Jetty, a Servlet container like Tomcat, is consuming more memory than JBoss, is because JBoss loads its stuff on demand. If you are deploying one application only, and one that does not utilizes 100% of the Java EE Full Profile feature set, you are in the end comparing Apples and Oranges, simply because you are comparing them based on _your_ demo project. And frankly, with the price of memory going down and its availability only going up, why do we still bother if an app server is consuming 35MB? Probably… Read more »
poor article …