Yammer Metrics, A new way to monitor your application
When you are running long term applications like web applications, it is good to know some statistics about them, like number of requests served, request durations, or the number active requests.
But also some more generic information like the state of your internal collections, how many times some portion of code is being executed, or health checks like database availability, or any kind of connection to an external system.
 All this kind of instrumentalization can be achieved by using native JMX or using a modular project like Metrics. Metrics provides a powerful way to measure the behaviour of your critical components and reporting them to a variety of systems like, JConsole, System Console, Ganglia, Graphite, CSV, or making them available through a web server. To install Metrics, we only have to add metrics dependency. In this example we are going to use Maven.
<dependencies>
    <dependency>
        <groupId>com.yammer.metrics</groupId>
        <artifactId>metrics-core</artifactId>
        <version>2.2.0</version>
    </dependency>
</dependencies>
Now it is time to add some metrics to our code. In Metrics we can use 6 types of metrics:
- Gauges: an instantaneous measurement of a discrete value.
- Counters: a value that can be incremented and decremented. Can be used in queues to monitorize the remaining number of pending jobs.
- Meters: measure the rate of events over time. You can specify the rate unit, the scope of events or event type.
- Histograms: measure the statistical distribution of values in a stream of data.
- Timers: measure the amount of time it takes to execute a piece of code and the distribution of its duration.
- Healthy checks: as his name suggests, it centralize our service’s healthy checks of external systems.
So let’s write a really simple application (in fact it is a console application) which sends queries to Google Search system. We will measure the number of petitions, the number of characters sent to Google, the last word searched, and a timer for measuring the rate of sending a request and receiving a response.
The main class where Measures will be applied is called MetricsApplication and is the responsible of connecting to Google and sending the entered word.
public class MetricsApplication {

           Counter

           private final Counter numberOfSendCharacters = Metrics.newCounter(MetricsApplication.class, 'Total-Number-Of-Characters');

           Meter

           private final Meter sendMessages = Metrics.newMeter(MetricsApplication.class, 'Sent-Messages', 'Send', TimeUnit.SECONDS);

           Timer

           private final Timer responseTime = Metrics.newTimer(MetricsApplication.class, 'Response-Time');

           private LinkedList<String> historyOfQueries = new LinkedList<String>();

           {

            Gauge

            Metrics.newGauge(MetricsApplication.class, 'lastQuery', new Gauge<String>() {

             @Override

             public String value() {

              return historyOfQueries.getLast();

             }

            });

           }

           public void sendQuery(String message) throws FailingHttpStatusCodeException, MalformedURLException, IOException {

            updateMetrics(message);

            TimerContext timerContext = responseTime.time();

            sendQueryToGoogle(message);

            timerContext.stop();

           }

           private void sendQueryToGoogle(String message) throws FailingHttpStatusCodeException, MalformedURLException, IOException {

            WebClient webClient = new WebClient();

            HtmlPage currentPage = webClient.getPage('http:www.google.com');

            Get the query input text

            HtmlInput queryInput = currentPage.getElementByName('q');

            queryInput.setValueAttribute(message);

            Submit the form by pressing the submit button

            HtmlSubmitInput submitBtn = currentPage.getElementByName('btnG');

            currentPage = submitBtn.click();

           }

           private void updateMetrics(String message) {

            numberOfSendCharacters.inc(message.length());

            sendMessages.mark();

            historyOfQueries.addLast(message);

           }

          }
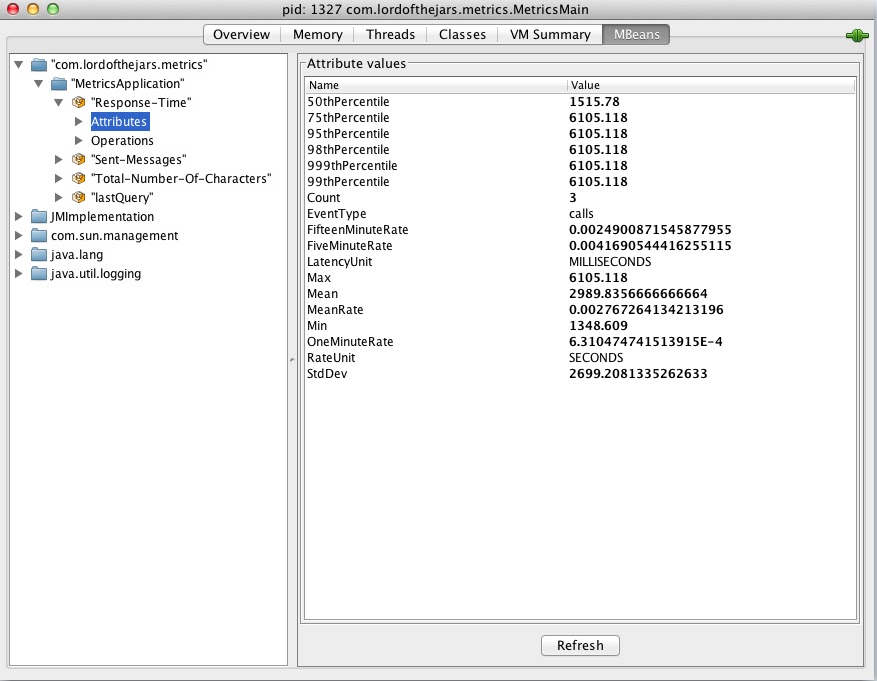
The first thing we can see is the counter instance. This counter will count the number of characters that are sent to Google in the whole life of the applications (meanwhile you don’t stop it).
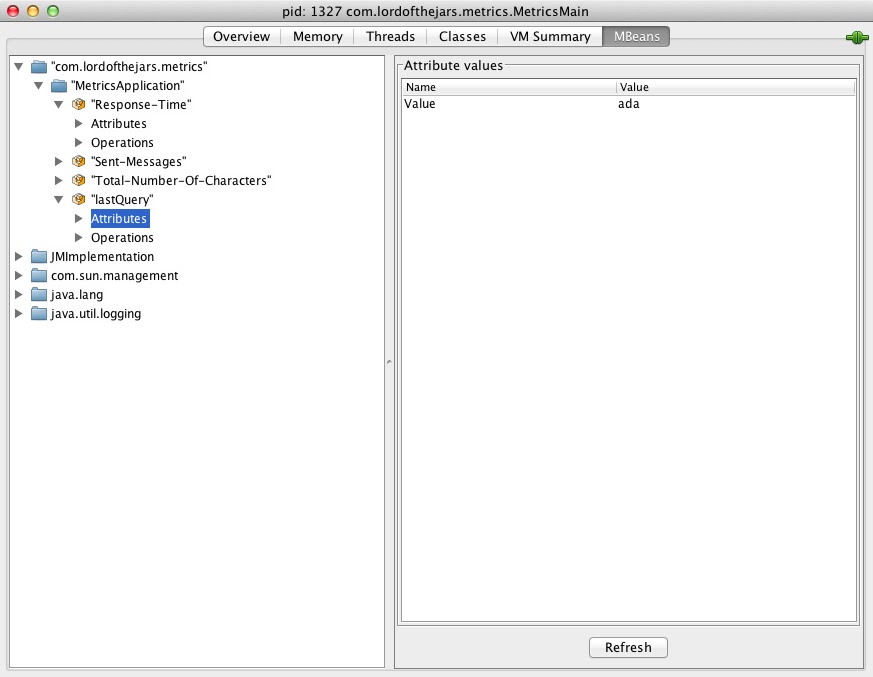
The next property is a meter that measures the rate of sending queries over time. Then we have got a timer that rates the sendQueryToGoogle method callings and its distribution over time. And finally a LinkedList for storing all queries sent. This instance will be used to return the last query executed, and is used in gauge for returning the last inserted element.
Notice that in each measure we are setting a class which will be used as folder in jconsole. Moreover a label is provided to be used as name inside folder.
Let’s see a screenshot of jconsole with previous configuration and an execution of three searches:
By default all metrics are visible via JMX. But of course we can report measurements to console, http server, Ganglia or Graphite.
Also note that in this example we are mixing business code and metrics code. If you are planning to use
Metrics in your production code I suggest you to put metrics logic into AOP whenever possible.
We have learned an easy way to monitorize our applications without using JMX directly. Also keep in mind that Metrics comes with some built-in metrics for instrumenting HttpClient, JDBI, Jetty, Jersey, Log4j, Logback or Web Applications.
Reference: Yammer Metrics, A new way to monitor your application from our JCG partner Alex Soto at the One Jar To Rule Them All blog.


