Datadog vs SignalFX vs New Relic vs Wavefront – Which Dashboard Should You Choose?
Are you ready to rumble? Prepare for the battle of the dashboards
There is a great number of monitoring applications in the market, each meant to help you understand what’s going on inside your applications. But with all due respect to fancy names and clever slogans, how can you be sure you’ll choose the right dashboard that will give you everything you need?
In the following post we’ll try to shed some light on some of these offers. We picked four tools that offer monitoring as a service, that’ll be able to help small or independent developers along big enterprises.
Getting Started
When we first sat down and started jotting ideas for this post, we wanted to pick a variety of monitoring tools that have different dashboards. It doesn’t matter if you’ve never heard the term “APM”, if you’re not sure why you should monitor your application or even if you already own a tool you know, use and love – this post is for you.
Our comparison list includes Datadog, SignalFX, New Relic and Wavefront. All four pitch themselves in the monitoring-as-a-service tooling landscape, but each includes its own extra secret sauce to try and get your attention. Not to worry, we’re here to help make sure you’ll make the right decision for you.
1. Collecting the Data
Every tool on our list uses an agent to collect the information needed to display a nice and informative dashboard. Each includes an installer for various platforms, and an option for manual installation for those of you who wants to be in full control, or do it yourselves. That’s why we decided to focus on what each company offers as part of its agent.
Datadog
The Datadog agent contains 3 components: the collector, dogstatsd and a forwarder. As the name implies, the collector collects system metrics (such as memory and CPU). The dogstatsd is a statsd backend server (StatsD is a front-end proxy for the Graphite/Carbon metrics server), to which you can send your custom metrics. Finally, the forwarder takes the information collected and sends it to the Datadog dashboard.
You’ll be able to install the agent on a range of platform, from Mac OS X, Windows and Ubuntu to Amazon Linux, CentOS, Fedora, Docker and many other options. Datadog even offers an option for you to request integrations for other tools you’d like to use during the installation process. That doesn’t mean the company will actually listen, but at least you tried.
SignalFX
There are a number of ways SignalFX can send over your desired metrics, and they include collectd, custom metrics or using third party applications. Collectd is an open source daemon that collects statistics and sends it to a destination of your choice – SignalFX dashboard in this case.
If you’re more of a custom metrics kind of user, you’ll be able to send your data directly from your application via a Ruby, Python, Java or Node.js. Using third party applications gives you the option to use one of your existing tools, such as AWS cloudwatch, Docker, Elasticsearch, MySQL or even New Relic, funny as it might sound.
New Relic
New Relic’s Java agent lets you track and collect your performance data, whether it’s performance issues, transactions or small errors inside your code. It offers support for Java, .NET, Node.js, PHP, Python and Ruby.
The company also offers a Java self installer for Tomcat, Jetty, JBoss and Glassfish. If you’re using other platforms, there’s a good chance you’ll have to manually edit the start scripts, where New Relic offers full documentation and support for these processes.
Wavefront
Unlike the other companies on this list, entering your email isn’t enough. If you want to sign up you have to enter your details, and wait for a salesman from the company to get back to you.
Bottom line: These tools all sound the same, using an agent to collect information and display it on your dashboard. Wavefront is lagging behind due to a complicated registration process, which will make most users pick a different tool they can see and use right now.
2. Dashboards and Secret Sauce
After we finish the installation process, it’s time to figure out what each tool has in store for us. It might feel as if a lot of similar features appear on each tool, but no doubt one dashboard isn’t similar to another.
Datadog
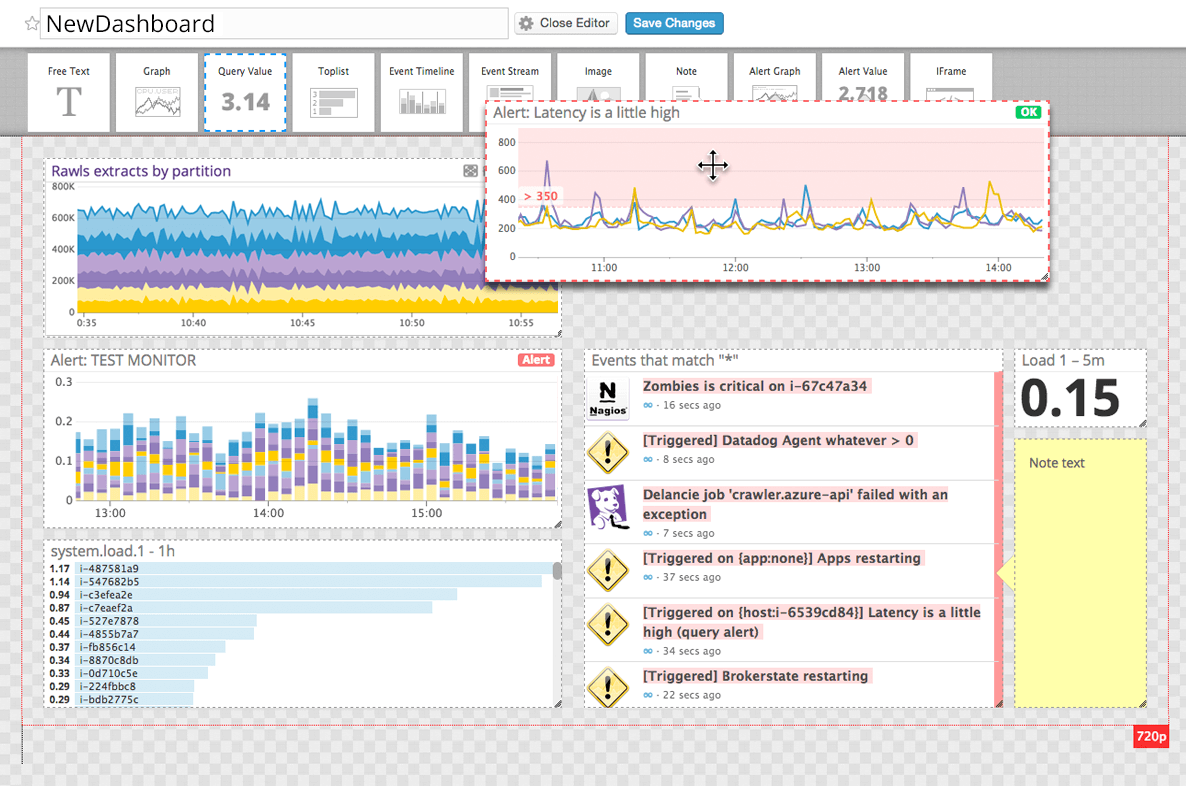
Once your agents are up and running, the dashboard will display graphs of real-time performance metrics and events from different parts of your infrastructure. You have the option to view data by host, device, total usage or any other tag you’d like, click and drag in order to zoom in on a certain time frame and even compute rates, ratios, averages or integrals.
It means that you can build your own dashboards to search and visualize across any data you have. Datadog also offer full access to their API, which means you can develop your very own metrics or integrations.
You can share dashboards, graphs and make sure everything is in sync and offers a real-time view between your teammates. In case you were worried, Datadog even mentioned support for large screen TVs, so you can spice up your office walls with your very own dashboards.
Secret sauce: The alerting system lets you set thresholds and rates from multiple hosts or data, see them in your timeline or even in alert-status widgets.
SignalFX
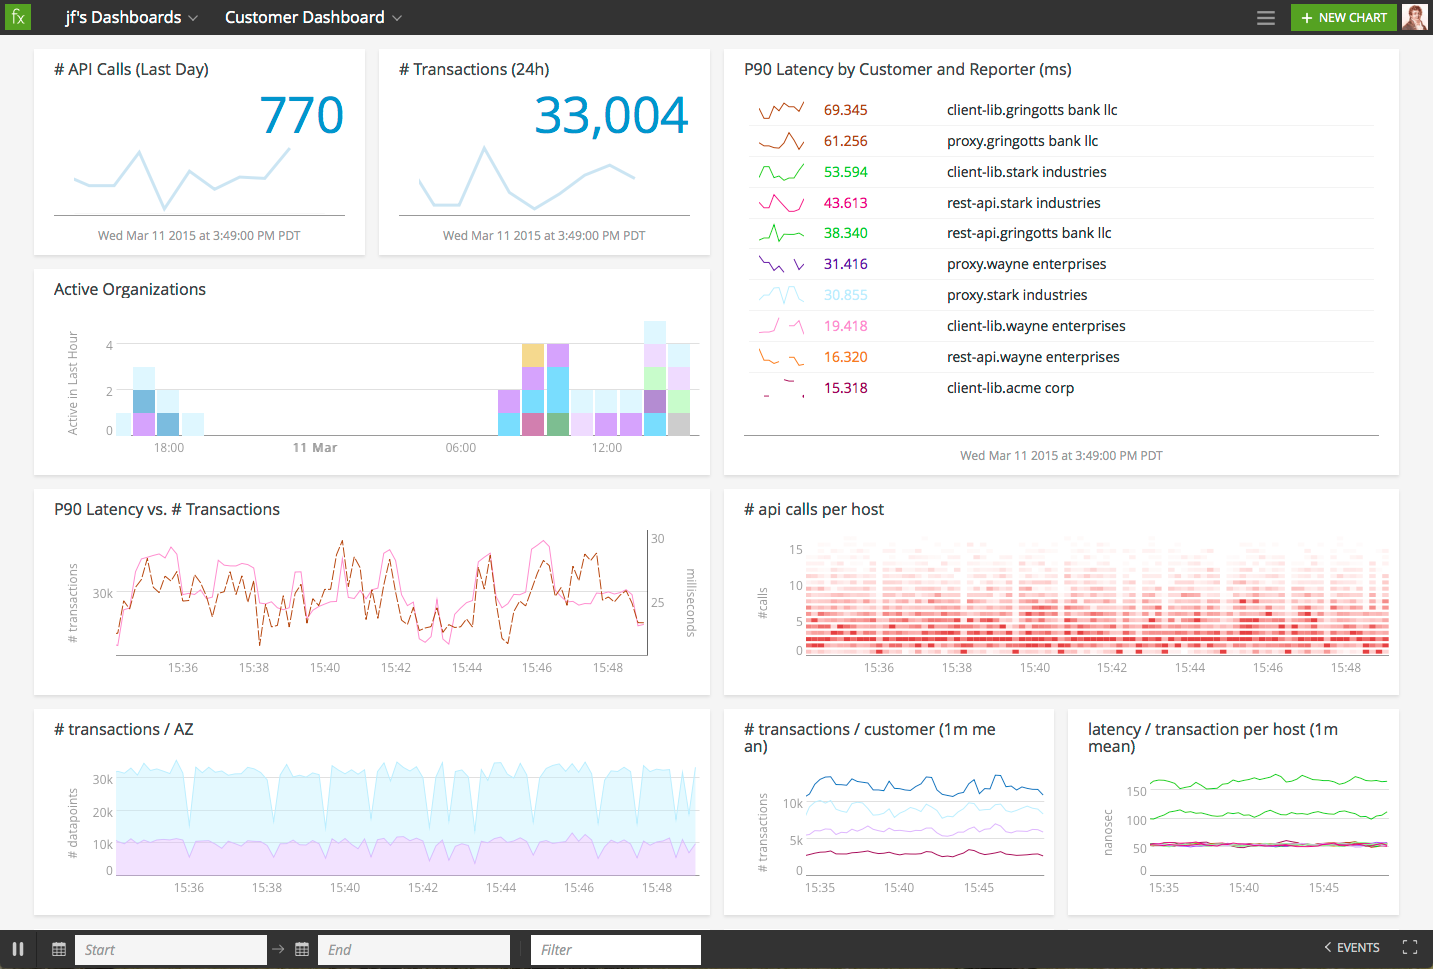
If you don’t have the time or resources to create your own custom dashboards, you can use one of the built-in options that will give you visibility to the technology and services being used in your environment. These dashboards appear in three locations: as part of Hosts (if relevant), in the Built-In Dashboard Groups section of Dashboards and in the Catalog.
A nice feature we came across was the ability to create similar dashboards. That way, you can replicate a setup from one environment to another, in order to test and analyze the behaviour in different parts of your application, or see the subset for a particular region or availability zone.
These are in addition to the “standard” options inside your dashboard: filter time-series, drag and drop reordering, selection of events and heatmap visualization of everything you need to know.
Secret sauce: The company’s key focus is the alerting system, where you can create, identify and isolate different thresholds according to your custom patterns. You can set up alerts for each component, and see them as events inside your dashboard.
New Relic
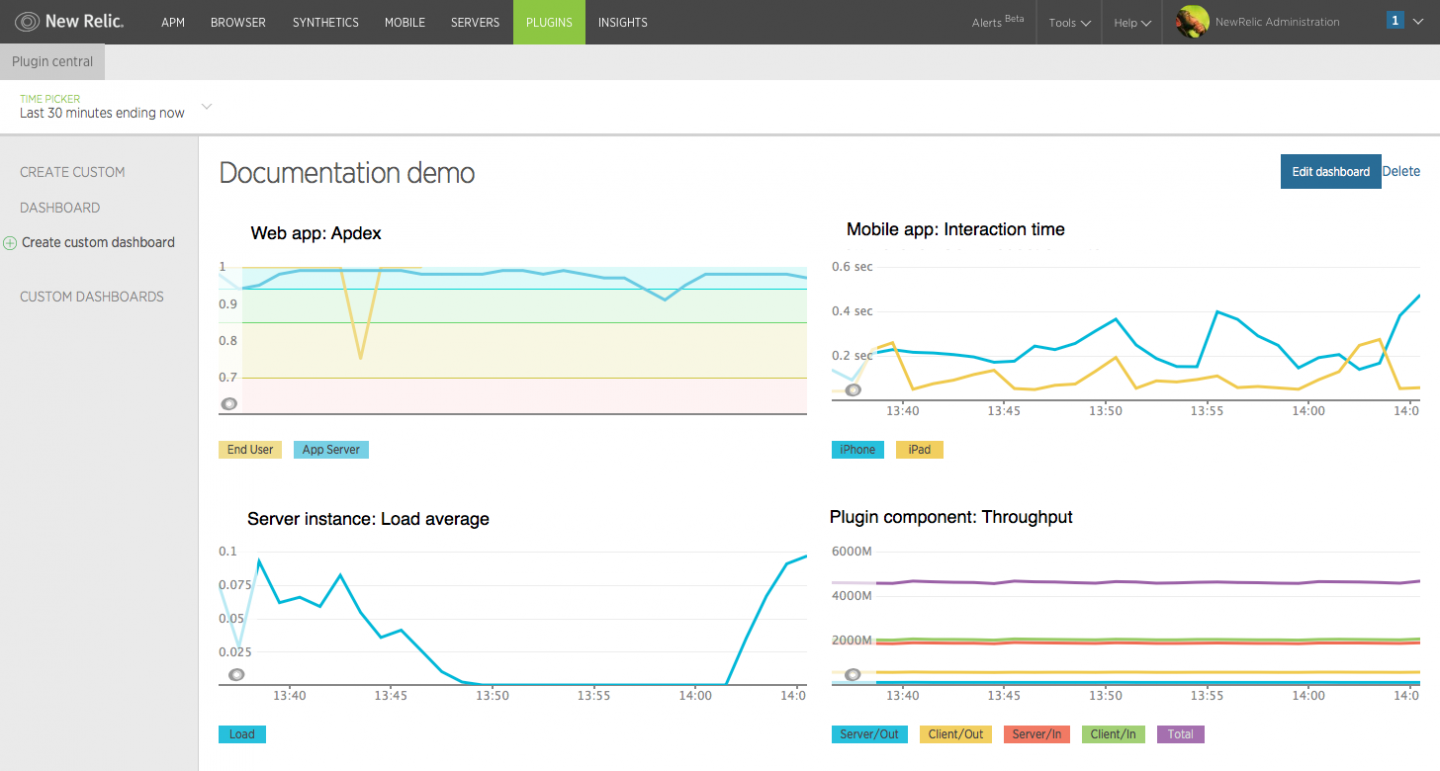
We can write a book about New Relic (and we totally kinda did!), so we’ll try to focus on what’s important for us here: the dashboard. Your main dashboard include everything you need in a glance: application response time, performance of internal and external services and even a preview of time consuming transitions among other important metrics.
Creating a custom dashboard enables presenting data the way you need it, whether it’s your mobile application information, server status, custom metrics you’d like to follow and plugin metric data.
Secret sauce: On the alerting side, you can set policies and conditions for the metrics that are relevant to you or to one of your team members. You can review events across different products, identify patterns and understand how many alerts you actually need in your system.
Wavefront
On their official website, Wavefront spends a lot of text describing color coding, rendering and visualization of their charts. What it actually means is that they’ve put some effort into their dashboard, in order to make it as friendly as possible for you.
Along with the bright colors, your dashboard will include events generated based on alerts, user activity, and external integrations. You can also send deployment information, configuration changes, code commits, marketing campaigns etc to get a broader view of your application status.
Secret sauce: If you want to work along with your teammates, Wavefront offer and option to build a single dashboard, and allowing your teammates to adjust parameters, let them choose from a fixed set of sample values or even define a dynamic variable that is populated with values from the results of another time series query.
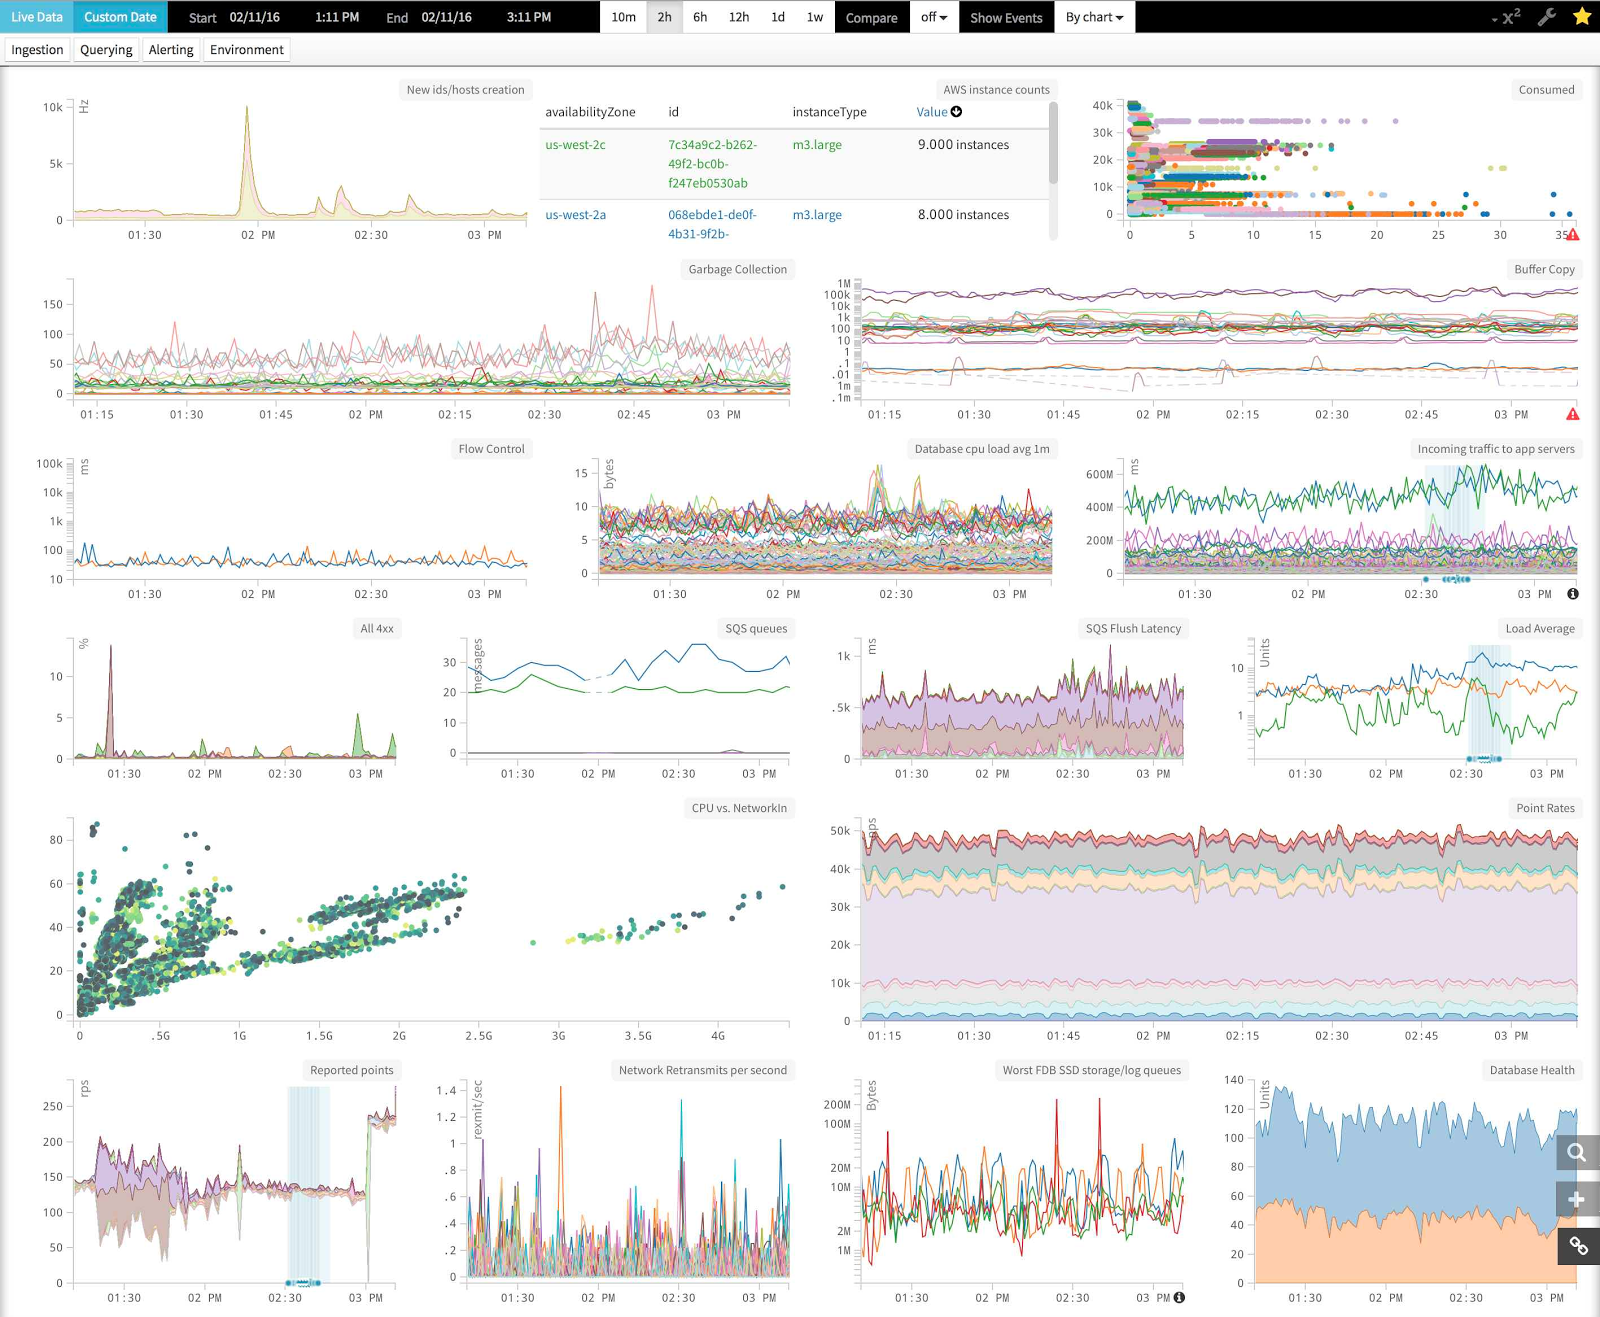
Bottom line: All dashboards are beautiful, each in its own special way. But you can’t judge a book by its cover, and the only advice we have here is that you should pick a dashboard according to the different options it holds inside that suits you best.
3. Integrations
A dashboard is great on its own, but it won’t wake you up in the middle of the night or help you get data on its own. How can you be sure the right information reach the right dashboard and is visual to your team members? Integrations.
Datadog
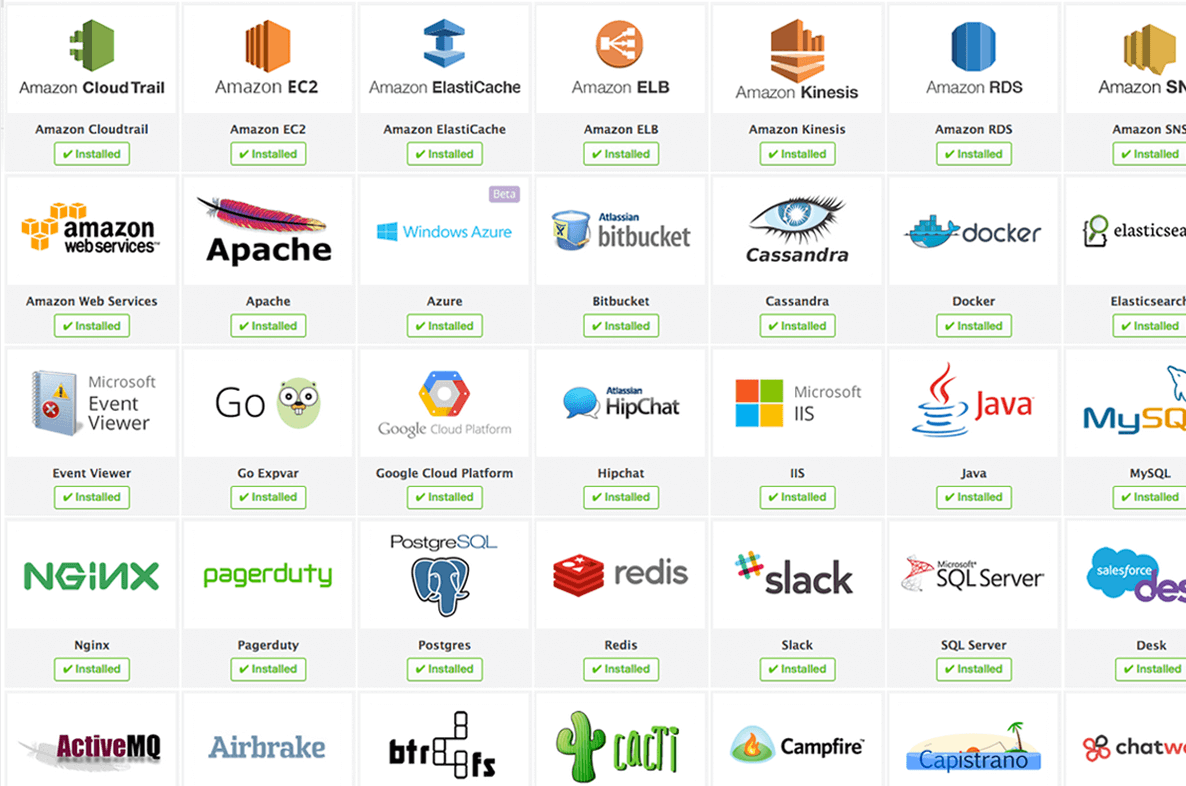
The company gathers performance data from any of your application components. Right now you’ll find about 100 different integrations to all of your favorite tools, such as Docker, Bitbucket, Fabric, GitHub, Pagerduty, Splunk and many many more.
Along with these built-in integrations, the fact that Datadog’s agent is open sourced and the company offers an API, you’ll be able to connect to any platform or tool that you’d like.
SignalFX
When you enter the integration dashboard, it is divided according to the type of integration you’re interested in. You’ll be able to connect with the SignalFX API using a Java, Ruby, Node.js or Python client, or use one of the collectd integrations. Since collectd is an open source daemon, you have a list of integrations to install and configure it that includes Chef, Apache, Docker, Zookeeper, MongoDB and others.
If you’re using AWS, you can connect SignalFX in a few single clicks, and if not – you can use Windows, Kubernetes or AppDynamics to send your own custom metrics. Beside collecting metrics, you can choose your favorite tool – Slack, Pagerduty, HipChat or anything else to get alerts about the issues and thresholds that you’ve configured.

New Relic
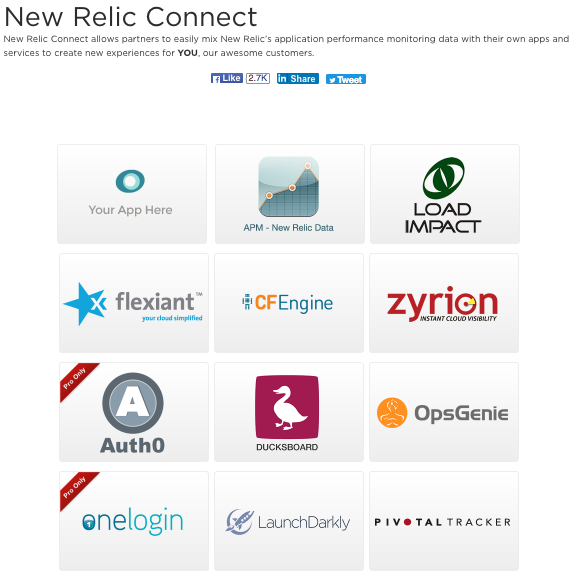
You won’t be surprised to find a long list of plugins that work with New Relic, such as Hadoop, RabbitMQ and Redis, that stream metrics of their data so you can view it on your dashboard. On the integrations side, New Relic allows partners to mix the application performance monitoring data with third party apps, in order to please the customers with a custom view.
On New Relic Connect you’ll find familiar names: Campfire, JIRA, WordPress, Bigpanda, Slack, Okta and even Datadog (don’t you just love when everyone’s working together?). This list offers more than enough resources to get all of your data, and send it to the right users.
Wavefront
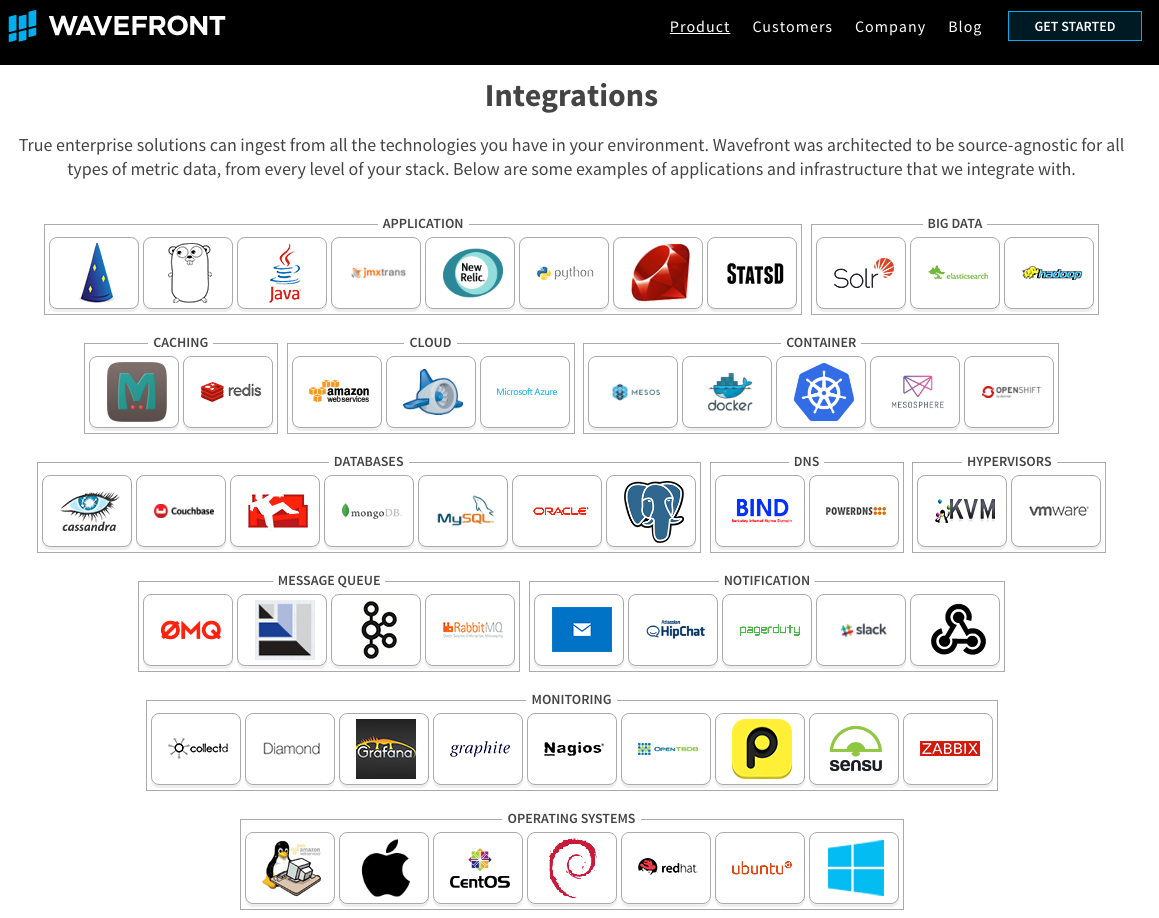
Since the company addresses enterprises, their integration page includes a lot of familiar (and some unfamiliar) names, sorted by the type of integration you might be looking for. Those sub-categories include application, big data, caching, cloud, container, databases, DNS, message queue, notification, monitoring and operating systems.
The company even offers integrations to storage platforms, such as NetApp, HP, EMC, IBM and Pure Storage, and you can connect via web and proxy using TomCat, NGINX and others.
Bottom line: If you’re an open source kind of person, Datadog is the best choice in this category. Other than that, all companies support pretty much the same popular tools you’re probably using.
4. Pricing
This is probably the most interesting question of them all: how much is this going to cost me? The answer is not as simple as you’d like.
Datadog
On the official pricing page you’ll be presented with three options: Free, Pro and Enterprise.
The free option include up to 5 monitoring hosts (machines), with 1 day retention and without the alerting options. The pro version starts at $15 per host/month, includes up to 500 hosts, 13 months retention, alerts and email support.
If you need more than 500 hosts, customized retention and phone support – you’ll have to call up the company to get an accurate price. You’ll also have to call them to find out what’s the datapoint rate for all 3 plans.
SignalFX
When you enter the pricing page, you can see that the company has a usage-based pricing model, that’s based on your data ingest rate. Even though it’s a flexible price, SignalFX is giving you a ball parked price of $15 per server/month. The company states that the $15/server/month estimate assumes that each server will generate 1,000 datapoints per minute (DPM) on average.
You will have to talk with a sales representative and get the accurate price from him, but hey, at least they’re trying.
New Relic
We have to admit that we were surprised to see that New Relic has a pricing page with actual prices. The essentials plan cost $0.10 per hour, and if you’ll use it for an entire month, it’ll cost you about $75/month (since a month has about 750 hours). It comes with 3 days of data retention (that include aggregate metrics, non aggregated insights events), alerting and custom dashboards and more.
The pro plan costs $0.20 per hour, which can come up to $149 per month. Here you’ll have 90 days of metrics, all features of APM essentials, monthly SLA reports and deployment tracking,
JVM monitoring and service topology maps and more.
All accounts start with a 14-day free pro trial, so you can see if you actually need it. After 14 days you’ll be moved to the lite plan, so you could have a taste from both worlds.
Wavefront
Just like you can’t sign up without getting permission (or a phone call) from the company, you can’t get the pricing info either.
Bottom line: When companies give out a price, even if it’s not accurate, it helps us understand what we’re up against. With so many tools and companies available today, not publishing any pricing plan is a risk – and yes Wavefront, we’re looking at you.
It seems that Datadog and SignalFX offer similar prices, while New Relic is far more expensive. But you can expect that, since the latter is a full APM solution.
5. Enhancing Your Dashboard
It doesn’t matter which dashboard caught your attention, they all give you an overall view of your application. Sure, it’s enough to know everything is up and working, but when it comes down to application errors, why should you stop at the stack trace level?
With Takipi, you can tell if a new deployment broke something in your code, get insight into all the errors happening in your application, and zoom in on critical issues. Takipi tells you when and why your code breaks in production, by getting down to the JVM level to bring you the actual code and variable state you need to solve each error.
Takipi runs as a native Java agent, and it does not require code changes, binary dependencies, or build configurations. With integrations like JIRA and Slack, Takipi is simple to slide into your existing workflow.
Final Thoughts
You probably have a long list of metrics, conditions and data you’d like to monitor inside your application at all time. But what good would it be, if you won’t be able to read all of this information on your dashboard?
As shallow as it might sound, looks are a big part of your day to day monitoring habits. Ideally, you should be able to get all of your desired information in a glance, without spending too much time deep-diving into logs and metrics.
While we don’t have all of the answers, we hope this post helped you get a different perspective when choosing a new tool. Who knows, it might help you cut down your time to issue resolution (And if not, there’s always Takipi for that).
| Reference: | Datadog vs SignalFX vs New Relic vs Wavefront – Which Dashboard Should You Choose? from our JCG partner Henn Idan at the Takipi blog. |

