Monitoring Kubernetes and OpenShift with AppDynamics
Continuously build, test and monitor your Microservices for optimal performance.
Summary
Kubernetes and OpenShift are powerful and flexible. They’re also complex to setup, monitor and maintain at scale. Here’s a sneak peek into what we monitor in OpenShift, as well as some hard-earned advice on how our strategy might benefit your own environments.
Here at AppDynamics, we build applications for both external and internal consumption. We’re always innovating to make our development and deployment process more efficient. We refactor apps to get the benefits of a microservices architecture, to develop and test faster without stepping on each other, and to fully leverage containerization.
Like many other organizations, we are embracing Kubernetes as a deployment platform. We use both upstream Kubernetes and OpenShift, an enterprise Kubernetes distribution on steroids. The Kubernetes framework is very powerful. It allows massive deployments at scale, simplifies new version rollouts and multi-variant testing, and offers many levers to fine-tune the development and deployment process.
At the same time, this flexibility makes Kubernetes complex in terms of setup, monitoring and maintenance at scale. Each of the Kubernetes core components (api-server, kube-controller-manager, kubelet, kube-scheduler) has quite a few flags that govern how the cluster behaves and performs. The default values may be OK initially for smaller clusters, but as deployments scale up, some adjustments must be made. We have learned to keep these values in mind when monitoring OpenShift clusters—both from our own pain and from published accounts of other community members who have experienced their own hair-pulling discoveries.
It should come as no surprise that we use our own tools to monitor our apps, including those deployed to OpenShift clusters. Kubernetes is just another layer of infrastructure. Along with the server and network visibility data, we are now incorporating Kubernetes and OpenShift metrics into the bigger monitoring picture.
In this blog, we will share what we monitor in OpenShift clusters and give suggestions as to how our strategy might be relevant to your own environments. (For more hands-on advice, read my blog Deploying AppDynamics Agents to OpenShift Using Init Containers.)
OpenShift Cluster Monitoring
For OpenShift cluster monitoring, we use two plug-ins that can be deployed with our standalone machine agent. AppDynamics’ Kubernetes Events Extension, described in our blog on monitoring Kubernetes events, tracks every event in the cluster. Kubernetes Snapshot Extension captures attributes of various cluster resources and publishes them to the AppDynamics Events API. The snapshot extension collects data on all deployments, pods, replica sets, daemon sets and service endpoints. It captures the full extent of the available attributes, including metadata, spec details, metrics and state. Both extensions use the Kubernetes API to retrieve the data, and can be configured to run at desired intervals.
The data these plug-ins provide ends up in our analytics data repository and instantly becomes available for mining
[one_third_last][/one_third_last]
[four_fifth_last][/four_fifth_last]
, reporting, baselining and visualization. The data retention period is at least 90 days, which offers ample time to go back and perform an exhaustive root cause analysis (RCA). It also allows you to reduce the retention interval of events in the cluster itself. (By default, this is set to one hour.)
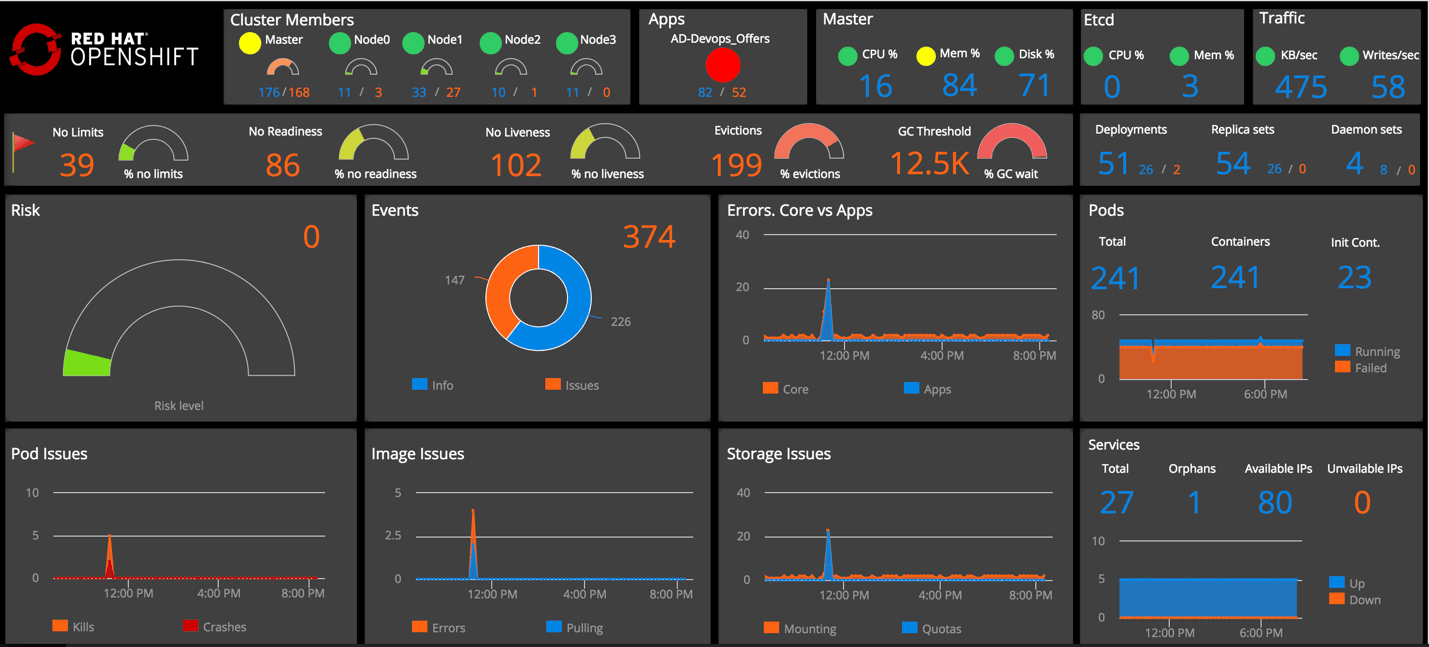
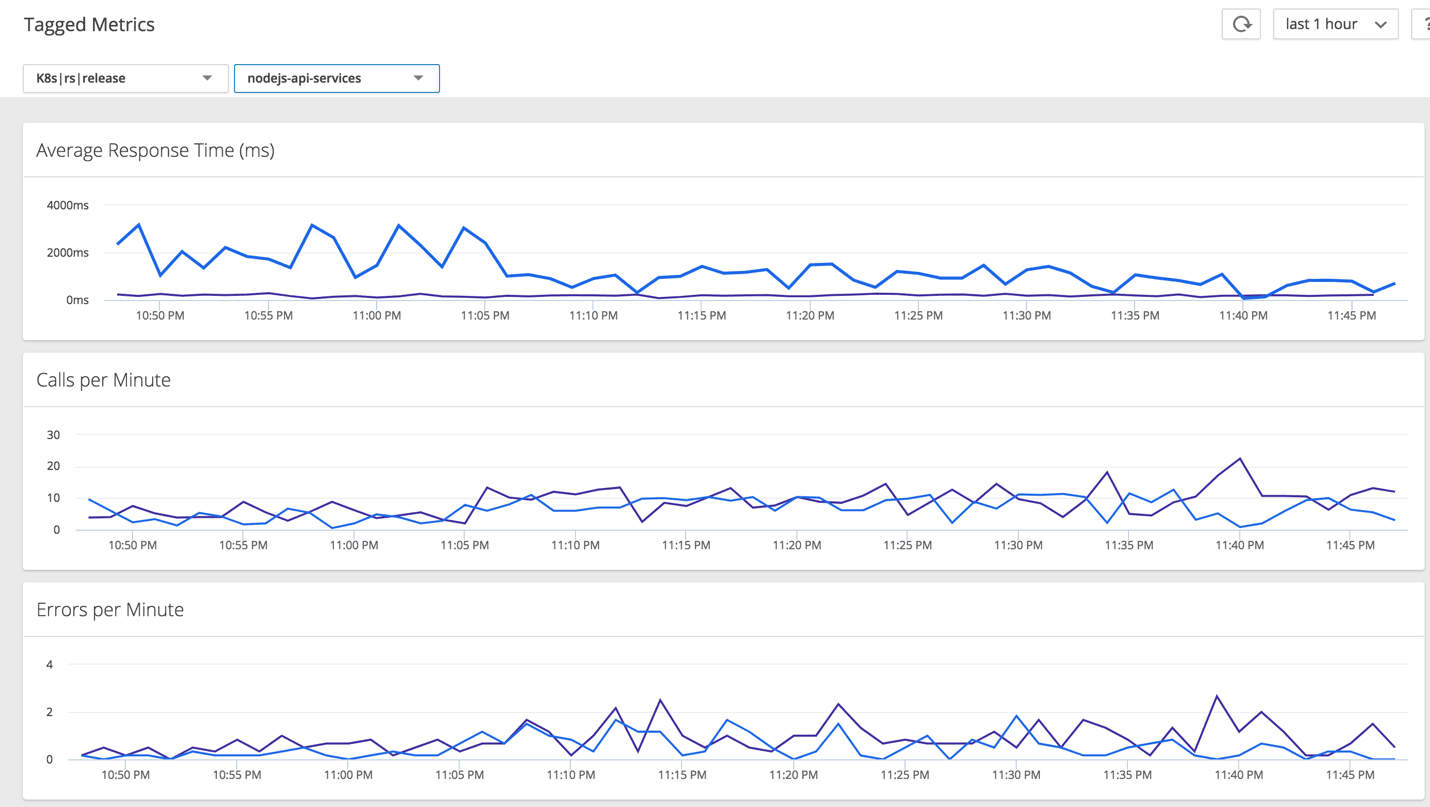
We use the collected data to build dynamic baselines, set up health rules and create alerts. The health rules, baselines and aggregate data points can then be displayed on custom dashboards where operators can see the norms and easily spot any deviations.
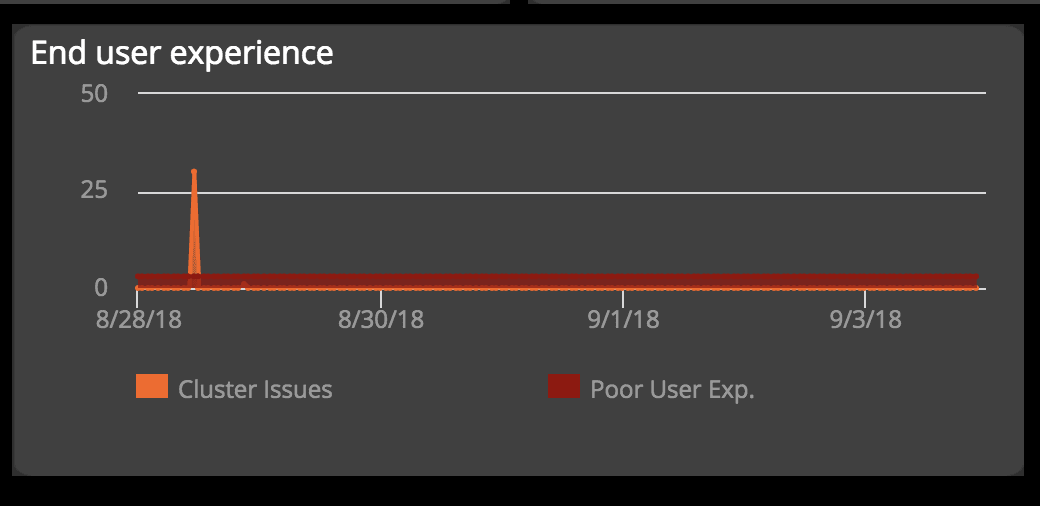
An example of a customizable Kubernetes dashboard.
What We Monitor and Why
Cluster Nodes
At the foundational level, we want monitoring operators to keep an eye on the health of the nodes where the cluster is deployed. Typically, you would have a cluster of masters, where core Kubernetes components (api-server, controller-manager, kube-schedule, etc.) are deployed, as well as a highly available etcd cluster and a number of worker nodes for guest applications. To paint a complete picture, we combine infrastructure health metrics with the relevant cluster data gathered by our Kubernetes data collectors.
From an infrastructure point of view, we track CPU, memory and disk utilization on all the nodes, and also zoom into the network traffic on etcd. In order to spot bottlenecks, we look at various aspects of the traffic at a granular level (e.g., reads/writes and throughput). Kubernetes and OpenShift clusters may suffer from memory starvation, disks overfilled with logs or spikes in consumption of the API server and, consequently, the etcd. Ironically, it is often monitoring solutions that are known for bringing clusters down by pulling excessive amounts of information from the Kubernetes APIs. It is always a good idea to establish how much monitoring is enough and dial it up when necessary to diagnose issues further. If a high level of monitoring is warranted, you may need to add more masters and etcd nodes. Another useful technique, especially with large-scale implementations, is to have a separate etcd cluster just for storing Kubernetes events. This way, the spikes in event creation and event retrieval for monitoring purposes won’t affect performance of the main etcd instances. This can be accomplished by setting the –etcd-servers-overrides flag of the api-server, for example:
–etcd-servers-overrides =/events#https://etcd1.cluster.com:2379;https://etcd2. cluster.com:2379;https://etcd3. cluster.com:2379
From the cluster perspective we monitor resource utilization across the nodes that allow pod scheduling. We also keep track of the pod counts and visualize how many pods are deployed to each node and how many of them are bad (failed/evicted).
A dashboard widget with infrastructure and cluster metrics combined.
Why is this important? Kubelet, the component responsible for managing pods on a given node, has a setting, –max-pods, which determines the maximum number of pods that can be orchestrated. In Kubernetes the default is 110. In OpenShift it is 250. The value can be changed up or down depending on need. We like to visualize the remaining headroom on each node, which helps with proactive resource planning and to prevent sudden overflows (which could mean an outage). Another data point we add there is the number of evicted pods per node.
Pod Evictions
Evictions are caused by space or memory starvation. We recently had an issue with the disk space on one of our worker nodes due to a runaway log. As a result, the kubelet produced massive evictions of pods from that node. Evictions are bad for many reasons. They will typically affect the quality of service or may even cause an outage. If the evicted pods have an exclusive affinity with the node experiencing disk pressure, and as a result cannot be re-orchestrated elsewhere in the cluster, the evictions will result in an outage. Evictions of core component pods may lead to the meltdown of the cluster.
Long after the incident where pods were evicted, we saw the evicted pods were still lingering. Why was that? Garbage collection of evictions is controlled by a setting in kube-controller-manager called –terminated-pod-gc-threshold. The default value is set to 12,500, which means that garbage collection won’t occur until you have that many evicted pods. Even in a large implementation it may be a good idea to dial this threshold down to a smaller number.
If you experience a lot of evictions, you may also want to check if kube-scheduler has a custom –policy-config-file defined with no CheckNodeMemoryPressure or CheckNodeDiskPressure predicates.
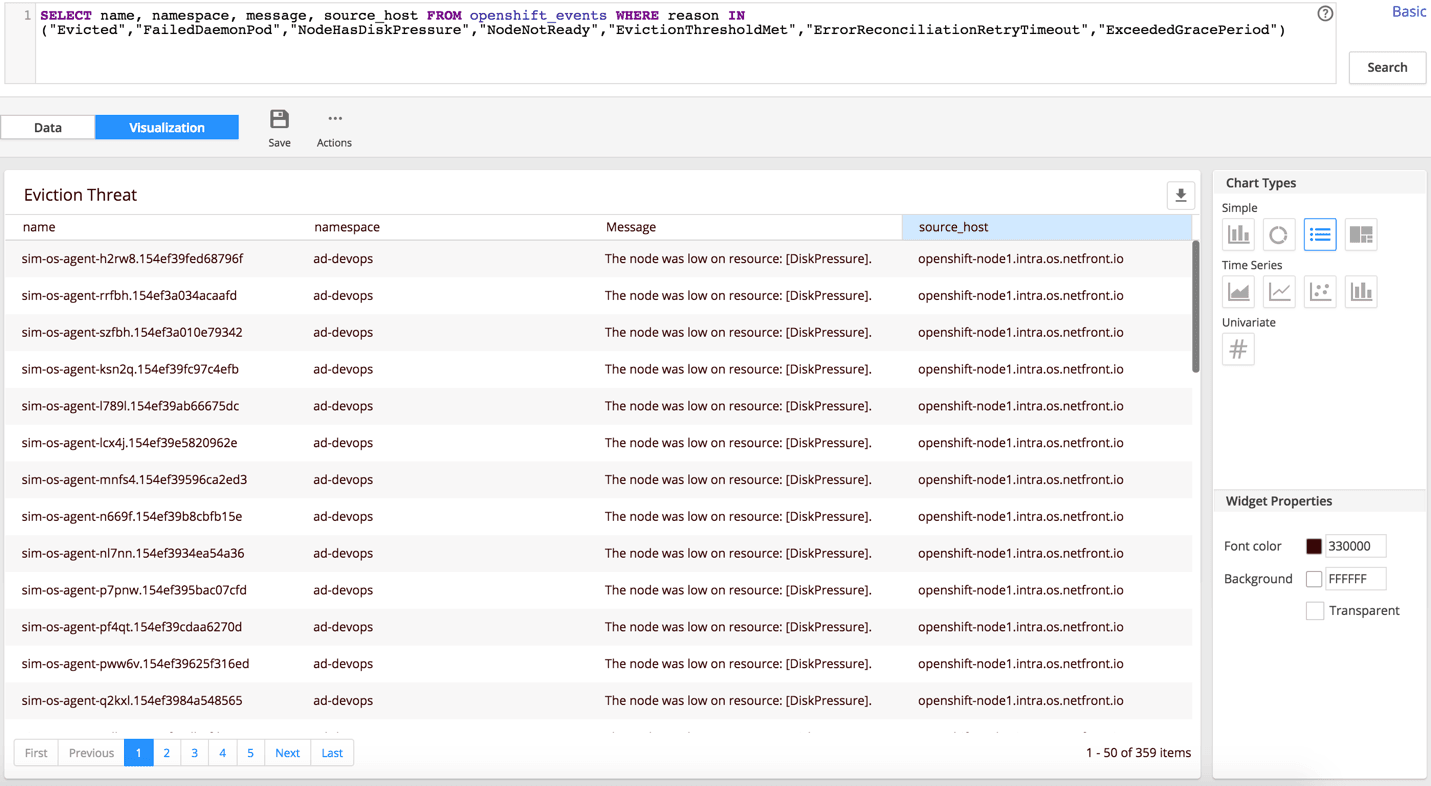
Following our recent incident, we set up a new dashboard widget that tracks a metric of any threats that may cause a cluster meltdown (e.g., massive evictions). We also associated a health rule with this metric and set up an alert. Specifically, we’re now looking for warning events that tell us when a node is about to experience memory or disk pressure, or when a pod cannot be reallocated (e.g., NodeHasDiskPressure, NodeHasMemoryPressure, ErrorReconciliationRetryTimeout, ExceededGracePeriod, EvictionThresholdMet).
We also look for daemon pod failures (FailedDaemonPod), as they are often associated with cluster health rather than issues with the daemon set app itself.
Pod Issues
Pod crashes are an obvious target for monitoring, but we are also interested in tracking pod kills. Why would someone be killing a pod? There may be good reasons for it, but it may also signal a problem with the application. For similar reasons, we track deployment scale-downs, which we do by inspecting ScalingReplicaSet events. We also like to visualize the scale-down trend along with the app health state. Scale-downs, for example, may happen by design through auto-scaling when the app load subsides. They may also be issued manually or in error, and can expose the application to an excessive load.
Pending state is supposed to be a relatively short stage in the lifecycle of a pod, but sometimes it isn’t. It may be good idea to track pods with a pending time that exceeds a certain, reasonable threshold—one minute, for example. In AppDynamics, we also have the luxury of baselining any metric and then tracking any configurable deviation from the baseline. If you catch a spike in pending state duration, the first thing to check is the size of your images and the speed of image download. One big image may clog the pipe and affect other containers. Kubelet has this flag, –serialize-image-pulls, which is set to “true” by default. It means that images will be loaded one at a time. Change the flag to “false” if you want to load images in parallel and avoid the potential clogging by a monster-sized image. Keep in mind, however, that you have to use Docker’s overlay2 storage driver to make this work. In newer Docker versions this setting is the default. In addition to the Kubelet setting, you may also need to tweak the max-concurrent-downloads flag of the Docker daemon to ensure the desired parallelism.
Large images that take a long time to download may also cause a different type of issue that results in a failed deployment. The Kubelet flag –image-pull-progress-deadline determines the point in time when the image will be deemed “too long to pull or extract.” If you deal with big images, make sure you dial up the value of the flag to fit your needs.
User Errors
Many big issues in the cluster stem from small user errors (human mistakes). A typo in a spec—for example, in the image name—may bring down the entire deployment. Similar effects may occur due to a missing image or insufficient rights to the registry. With that in mind, we track image errors closely and pay attention to excessive image-pulling. Unless it is truly needed, image-pulling is something you want to avoid in order to conserve bandwidth and speed up deployments.
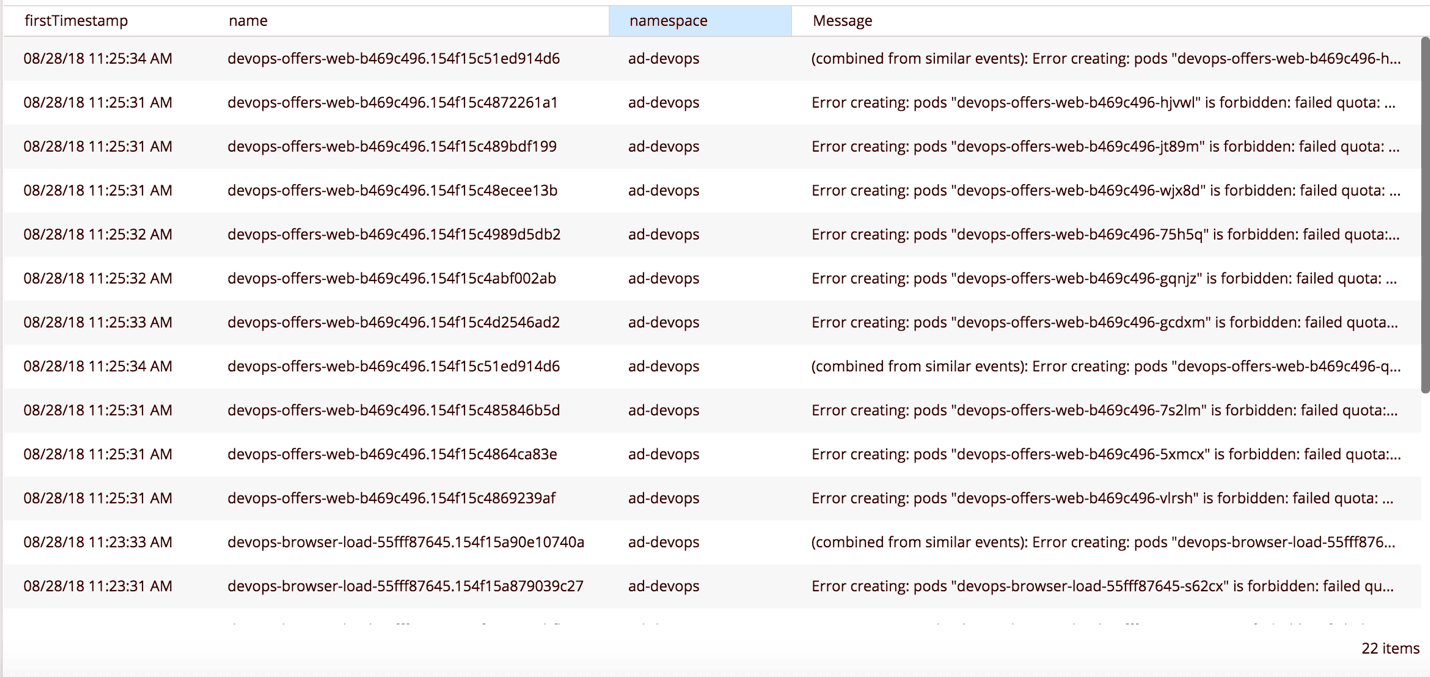
Storage issues also tend to arise due to spec errors, lack of permissions or policy conflicts. We monitor storage issues (e.g., mounting problems) because they may cause crashes. We also pay close attention to resource quota violations because they do not trigger pod failures. They will, however, prevent new deployments from starting and existing deployments from scaling up.
Speaking of quota violations, are you setting resource limits in your deployment specs?
Policing the Cluster
On our OpenShift dashboards, we display a list of potential red flags that are not necessarily a problem yet but may cause serious issues down the road. Among these are pods without resource limits or health probes in the deployment specs.
Resource limits can be enforced by resource quotas across the entire cluster or at a more granular level. Violation of these limits will prevent the deployment. In the absence of a quota, pods can be deployed without defined resource limits. Having no resource limits is bad for multiple reasons. It makes cluster capacity planning challenging. It may also cause an outage. If you create or change a resource quota when there are active pods without limits, any subsequent scale-up or redeployment of these pods will result in failures.
The health probes, readiness and liveness are not enforceable, but it is a best practice to have them defined in the specs. They are the primary mechanism for the pods to tell the kubelet whether the application is ready to accept traffic and is still functioning. If the readiness probe is not defined and the pods takes a long time to initialize (based on the kubelet’s default), the pod will be restarted. This loop may continue for some time, taking up cluster resources for no reason and effectively causing a poor user experience or outage.
The absence of the liveness probe may cause a similar effect if the application is performing a lengthy operation and the pod appears to Kubelet as unresponsive.
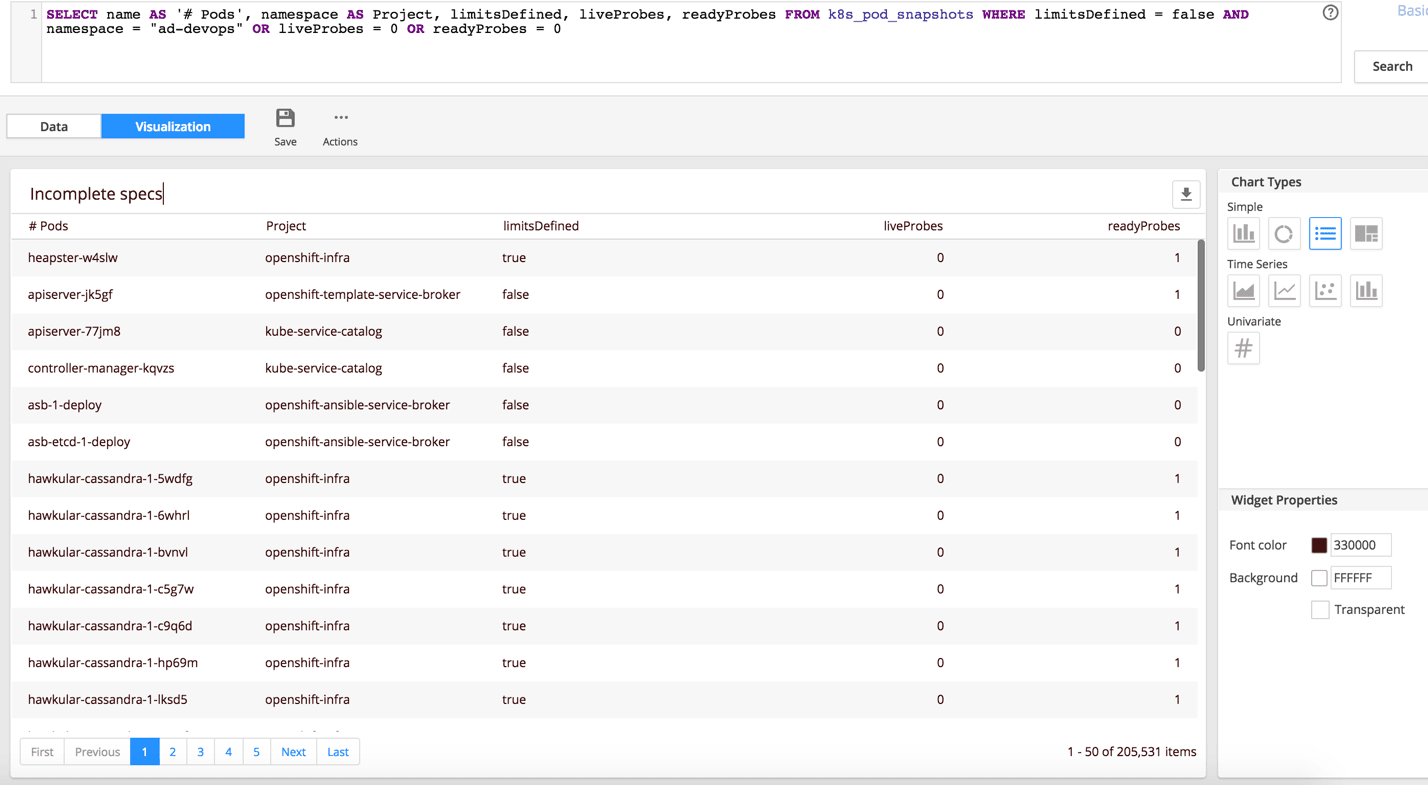
We provide easy access to the list of pods with incomplete specs, allowing cluster admins to have a targeted conversation with development teams about corrective action.
Routing and Endpoint Tracking
As part of our OpenShift monitoring, we provide visibility into potential routing and service endpoint issues. We track unused services, including those created by someone in error and those without any pods behind them because the pods failed or were removed.
We also monitor bad endpoints pointing at old (deleted) pods, which effectively cause downtime. This issue may occur during rolling updates when the cluster is under increased load and API request-throttling is lower than it needs to be. To resolve the issue, you may need to increase the –kube-api-burst and –kube-api-qps config values of kube-controller-manager.
Every metric we expose on the dashboard can be viewed and analyzed in the list and further refined with ADQL, the AppDynamics query language. After spotting an anomaly on the dashboard, the operator can drill into the raw data to get to the root cause of the problem.
Application Monitoring
Context plays a significant role in our monitoring philosophy. We always look at application performance through the lens of the end-user experience and desired business outcomes. Unlike specialized cluster-monitoring tools, we are not only interested in cluster health and uptime per se. We’re equally concerned with the impact the cluster may have on application health and, subsequently, on the business objectives of the app.
In addition to having a cluster-level dashboard, we also build specialized dashboards with a more application-centric point of view. There we correlate cluster events and anomalies with application or component availability, end-user experience as reported by real-user monitoring, and business metrics (e.g., conversion of specific user segments).
Leveraging K8s Metadata
Kubernetes makes it super easy to run canary deployments, blue-green deployments, and A/B or multivariate testing. We leverage these conveniences by pulling deployment metadata and using labels to analyze performance of different versions side by side.
Monitoring Kubernetes or OpenShift is just a part of what AppDynamics does for our internal needs and for our clients. AppDynamics covers the entire spectrum of end-to-end monitoring, from the foundational infrastructure to business intelligence. Inherently, AppDynamics is used by many different groups of operators who may have very different skills. For example, we look at the platform as a collaboration tool that helps translate the language of APM to the language of Kubernetes and vice versa.
By bringing these different datasets together under one umbrella, AppDynamics establishes a common ground for diverse groups of operators. On the one hand you have cluster admins, who are experts in Kubernetes but may not know the guest applications in detail. On the other hand, you have DevOps in charge of APM or managers looking at business metrics, both of whom may not be intimately familiar with Kubernetes. These groups can now have a productive monitoring conversation, using terms that are well understood by everyone and a single tool to examine data points on a shared dashboard.
Learn more about how AppDynamics can help you monitor your applications on Kubernetes and OpenShift.
Continuously build, test and monitor your Microservices for optimal performance.


