OpenJPA: Memory Leak Case Study
This article will provide the complete root cause analysis details and resolution of a Java heap memory leak (Apache OpenJPA leak) affecting an Oracle Weblogic server 10.0 production environment. This post will also demonstrate the importance to follow the Java Persistence API best practices when managing the javax.persistence.EntityManagerFactory lifecycle.
Environment specifications
- Java EE server: Oracle Weblogic Portal 10.0
- OS: Solaris 10
- JDK: Oracle/Sun HotSpot JVM 1.5 32-bit @2 GB capacity
- Java Persistence API: Apache OpenJPA 1.0.x (JPA 1.0 specifications)
- RDBMS: Oracle 10g
- Platform type: Web Portal
Troubleshooting tools
- Quest Foglight for Java (Java heap monitoring)
- MAT (Java heap dump analysis)
Problem description & observations
The problem was initially reported by our Weblogic production support team following production outages. An initial root cause analysis exercise did reveal the following facts and observations:
- Production outages were observed on regular basis after ~2 weeks of traffic.
- The failures were due to Java heap (OldGen) depletion e.g. OutOfMemoryError: Java heap space error found in the Weblogic logs.
- A Java heap memory leak was confirmed after reviewing the Java heap OldGen space utilization over time from Foglight monitoring tool along with the Java verbose GC historical data.
Following the discovery of the above problems, the decision was taken to move to the next phase of the RCA and perform a JVM heap dump analysis of the affected Weblogic (JVM) instances.
JVM heap dump analysis
** A video explaining the following JVM Heap Dump analysis is now available here. In order to generate a
JVM heap dump the supported team did use the HotSpot 1.5 jmap utility which generated a heap dump file (heap.bin) of about ~1.5 GB. The heap dump file was then analyzed using the Eclipse Memory Analyzer Tool. Now let’s review the heap dump analysis so we can understand the source of the OldGen memory leak.
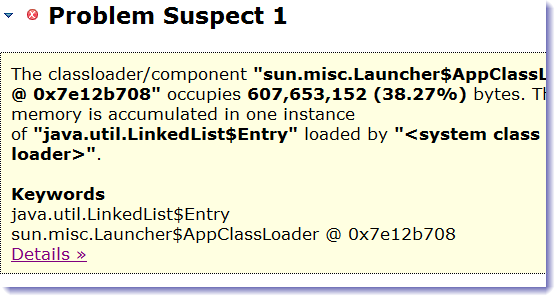
MAT provides an initial Leak Suspects report which can be very useful to highlight your high memory contributors. For our problem case, MAT was able to identify a leak suspect contributing to almost 600 MB or 40% of the total OldGen space capacity.
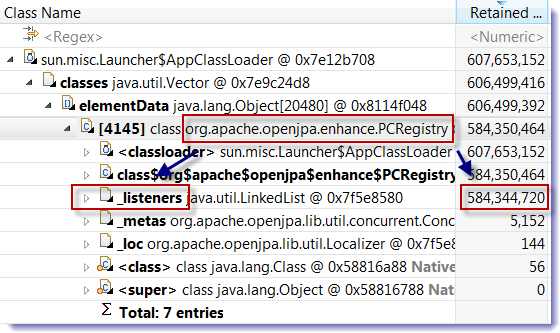
At this point we found one instance of java.util.LinkedList using almost 600 MB of memory and loaded to one of our application parent class loader (@ 0x7e12b708). The next step was to understand the leaking objects along with the source of retention. MAT allows you to inspect any class loader instance of your application, providing you with capabilities to inspect the loaded classes & instances. Simply search for the desired object by providing the address e.g. 0x7e12b708 and then inspect the loaded classes & instances by selecting List Objects > with outgoing references.
As you can see from the above snapshot, the analysis was quite revealing. What we found was one instance of org.apache.openjpa.enhance.PCRegistry at the source of the memory retention; more precisely the culprit was the _listeners field implemented as a LinkedList. For your reference, the Apache OpenJPA PCRegistry is used internally to track the registered persistence-capable classes. Find below a snippet of the PCRegistry source code from Apache OpenJPA version 1.0.4 exposing the _listeners field.
/**
 * Tracks registered persistence-capable classes.
 *
 * @since 0.4.0
 * @author Abe White
 */
public class PCRegistry {
    // DO NOT ADD ADDITIONAL DEPENDENCIES TO THIS CLASS

    private static final Localizer _loc = Localizer.forPackage
        (PCRegistry.class);

    // map of pc classes to meta structs; weak so the VM can GC classes
    private static final Map _metas = new ConcurrentReferenceHashMap
        (ReferenceMap.WEAK, ReferenceMap.HARD);

    // register class listeners
    private static final Collection _listeners = new LinkedList();
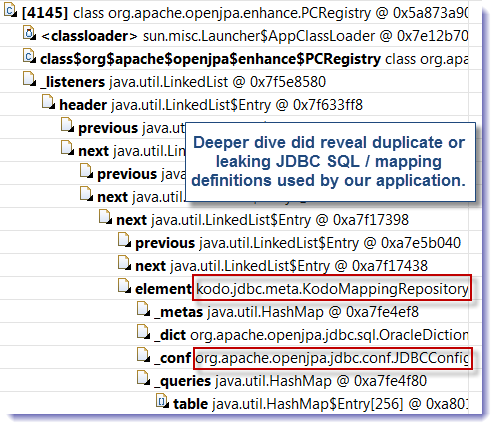
Now the question is why is the memory footprint of this internal data structure so big and potentially leaking over time? The next step was to deep dive into the _listeners LinkedLink instance in order to review the leaking objects.
We finally found that the leaking objects were actually the JDBC & SQL mapping definitions (metadata) used by our application in order to execute various queries against our Oracle database. A review of the JPA specifications, OpenJPA documentation and source did confirm that the root cause was associated with a wrong usage of the javax.persistence.EntityManagerFactory such of lack of closure of a newly created EntityManagerFactory instance.
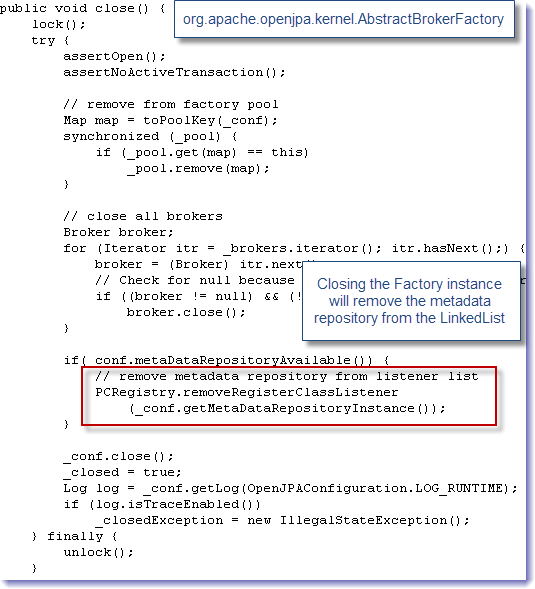
If you look closely at the above code snapshot, you will realize that the close() method is indeed responsible to cleanup any recently used metadata repository instance. It did also raise another concern, why are we creating such Factory instances over and over… The next step of the investigation was to perform a code walkthrough of our application code, especially around the life cycle management of the JPA EntityManagerFactory and EntityManager objects.
Root cause and solution
A code walkthrough of the application code did reveal that the application was creating a new instance of EntityManagerFactory on each single request and not closing it properly.
 public class Application {

       @Resource
       private UserTransaction utx = null;

       // Initialized on each application request and not closed!
       @PersistenceUnit(unitName = "UnitName")
       private EntityManagerFactory emf = Persistence.createEntityManagerFactory("PersistenceUnit");

       public EntityManager getEntityManager() {
             return this.emf.createEntityManager();
       }

       public void businessMethod() {

             // Create a new EntityManager instance via from the newly created EntityManagerFactory instance
             // Do something...
             // Close the EntityManager instance
       }
}
This code defect and improver use of JPA EntityManagerFactory was causing a leak or accumulation of metadata repository instances within the OpenJPA _listeners data structure demonstrated from the earlier JVM heap dump analysis. The solution of the problem was to centralize the management & life cycle of the thread safe javax.persistence.EntityManagerFactory via the Singleton pattern. The final solution was implemented as per below:
- Create and maintain only one static instance of javax.persistence.EntityManagerFactory per application class loader and implemented via the Singleton Pattern.
- Create and dispose new instances of EntityManager for each application request.
Please review this discussion from Stackoverflow as the solution we implemented is quite similar. Following the implementation of the solution to our production environment, no more Java heap OldGen memory leak is observed.
Reference: OpenJPA: Memory Leak Case Study from our JCG partner Pierre-Hugues Charbonneau at the Java EE Support Patterns & Java Tutorial blog.


Good Analysis. :)