7 Options to capture Java heap dumps
Heap Dumps are vital artifacts to diagnose memory-related problems such as slow memory leaks, Garbage Collection problems, and java.lang.OutOfMemoryError.They are also vital artifacts to optimize the memory consumption.
There are great tools like Eclipse MAT and Heap Hero to analyze heap dumps. However, you need to provide these tools with heap dumps captured in the correct format and correct point in time.
This article gives you multiple options to capture heap dumps. However, in my opinion, first 3 are effective options to use and others are good options to be aware.

1. jmap
jmap print heap dumps into specified file location. This tool is packaged within JDK. It can be found in bin folder.
Here is how you should invoke jmap:
1 2 3 4 5 | jmap -dump:format=b,file=<file-path> <pid> wherepid: is the Java Process Id, whose heap dump should be capturedfile-path: is the file path where heap dump will be written in to. |
Example:
| 1 | jmap -dump:format=b,file=/opt/tmp/heapdump.bin 37320 |
Note: It’s quite important to pass “live” option. If this option is passed, then only live objects in the memory are written into the heap dump file. If this option is not passed, all the objects, even the ones which are ready to be garbage collected are printed in the heap dump file. It will increase the heap dump file size significantly. It will also make the analysis tedious. To troubleshoot memory problems or optimize memory, just “live” option should suffice the need.
2. HeapDumpOnOutOfMemoryError
When application experience java.lang.OutOfMemoryError, it’s ideal to capture heap dump right at that point to diagnose the problem because you want to know what objects were sitting in memory and what percentage of memory they were occupying when java.lang.OutOfMemoryError occurred. However, due to the heat of the moment, most times, IT/Operations team forgets to capture heap dump. Not only that, they also restart the application. It’s extremely hard to diagnose any memory problems without capturing heap dumps at right time.
That’s where this option comes very handy. When you pass ‘-XX:+HeapDumpOnOutOfMemoryError’ system property during application startup, JVM will capture heap dumps right at the point when JVM experiences OutOfMemoryError.
Sample Usage:
1 | -XX:+HeapDumpOnOutOfMemoryError -XX:HeapDumpPath=/opt/tmp/heapdump.bin |
Note: Captured heap dump will be printed at the location specified by ‘-XX:HeapDumpPath’ system property.

Best Practice: Keep this property configured in all the applications at all the times, as you never know when OutOfMemoryError will happen.jcmd3.
3. jcmd
jcmd tool is used to send diagnostic command requests to the JVM. It’s packaged as part of JDK. It can be found in bin folder.
Here is how you should invoke jcmd:
1 2 3 4 | jcmd <pid> GC.heap_dump <file-path>wherepid: is the Java Process Id, whose heap dump should be capturedfile-path: is the file path where heap dump will be written in to. |
Example:
| 1 jcmd 37320 GC.heap_dump /opt/tmp/heapdump.bin |
4. JVisualVM
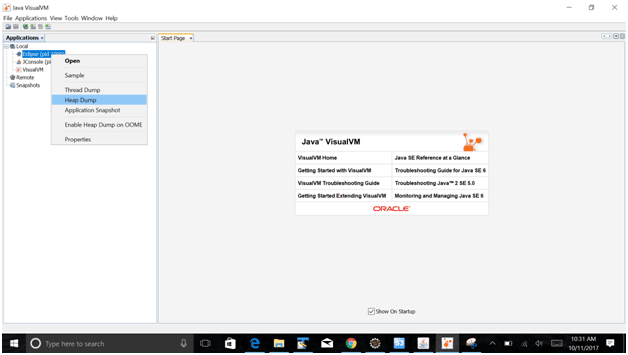
JVisualVM is a monitoring, troubleshooting tool that is packaged within the JDK. When you launch this tool, you can see all the Java processes that are running on the local machine. You can also connect to java process running on remote machine using this tool.
Steps:
- Launch jvisualvm under bin folder
- Right click on one of the Java process
- Click on the ‘Heap Dump’ option on the drop-down menu
- Heap dump will be generated
- File path where heap dump is generated will be specified in the Summary Tab > Basic Info > File section

5. JMX
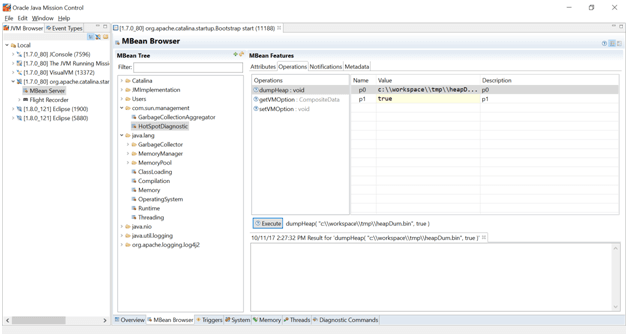
There is a com.sun.management:type=HotSpotDiagnostic MBean. This MBean has ‘dumpHeap’ operation. Invoking this operation will capture the heap dump. ‘dumpHeap’ operation takes two input parameters:
- outputFile: File path where heap dump should be written
- live: When ‘true’ is passed only live objects in heap are captured
You can use JMX clients such as JConsole, jmxsh, Java Mission Control to invoke this MBean operation.

6. Programmatic Approach
Instead of using tools, you can also programmatically capture heap dumps from the application. There might be cases where you want to capture heap dumps based on certain events in the application. Here is a good article from Oracle which gives the source code for capturing heap dumps from the application, by invoking the com.sun.management:type=HotSpotDiagnostic MBean JMX Bean, that we discussed in the above approach.
7. IBM Administrative Console
If your application is running on IBM Websphere Application Server, you can use the administrative console to generate heaps.
Steps:
- Start administrative console
- In the navigation pane, click Troubleshooting > Java dumps and cores
- Select the server_name for which you want to generate the heap dump
- Click Heap dump to generate the heap dump for your specified server
You can also use wsadmin to generate heap dumps.
Published on Java Code Geeks with permission by Ayusch Jain, partner at our JCG program. See the original article here: 7 Options to capture Java heap dumps Opinions expressed by Java Code Geeks contributors are their own. |


